EX-99.1
Published on October 22, 2024
Exhibit 99.1 Lender Presentation October 22, 2024 CONFIDENTIAL
Cautionary Statements About this Presentation The information in this presentation is current only as of the date on its cover. For any time after the cover date of this presentation, the information, including information concerning the business, financial condition, results of operations and prospects of Construction Partners, Inc. (“CPI” or the “Company”), may have changed. The delivery of this presentation shall not, under any circumstances, create any implication that there have been no changes in the Company’s affairs after the date of this presentation. The Company’s fiscal year ends on September 30th of any given year, and the fiscal year of Asphalt Inc., LLC d/b/a Lone Star Paving (“LSP”) has historically ended on December 31st of any given year. Any reference in this presentation to a fiscal year refers to the fiscal year ended September 30th of that year, unless otherwise noted. The Company has not authorized any person to give any information or to make any representations about the Company in connection with this presentation that are not contained herein. If any information has been or is given or any representations have been or are made to you outside of this presentation, such information or representations should not be relied upon as having been authorized by the Company. Forward-Looking Statements Certain statements contained herein relating to the Company or LSP that are not statements of historical or current fact constitute “forward-looking statements” within the meaning of Section 27A of the Securities Act of 1933, as amended (the “Securities Act”), and Section 21E of the Securities Exchange Act of 1934, as amended. These statements may be identified by the use of words such as “seek,” “continue,” “estimate,” “predict,” “potential,” “targeting,” “could,” “might,” “may,” “will,” “expect,” “should,” “anticipate,” “intend,” “project,” “outlook,” “believe,” “plan” and similar expressions or their negative. These forward- looking statements include, among others, statements regarding the anticipated timing of closing the Company’s acquisition of LSP; estimates of future synergies, savings and efficiencies relating to the Company’s acquisition of LSP; expectations regarding the Company’s ability to effectively integrate assets and properties it may acquire as a result of the Company’s acquisition of LSP; expectations of future plans, priorities, focuses, and benefits of the Company’s acquisition of LSP; expectations regarding the Company’s ability to obtain financing in connection with its acquisition of LSP; and statements regarding the expected financial performance of the Company following its acquisition of LSP, including statements regarding the Company’s expected Revenue, Net Income, Adjusted EBITDA and Adjusted EBITDA Margin for the fiscal year ended September 30, 2024. Important factors that could cause actual results to differ materially from those expressed in the forward-looking statements, include, among others, the ability of the parties to consummate the acquisition of LSP in a timely manner, or at all; satisfaction of any conditions precedent to the consummation of the Company’s acquisition of LSP, including the ability to obtain required regulatory approvals in a timely manner, or at all; the Company’s ability to obtain financing to fund its acquisition of LSP on favorable terms, or at all; failure to realize the anticipated benefits of the Company’s acquisition of LSP; the preliminary financial information remaining subject to changes and finalization based upon management’s ongoing review of results for the fiscal year ended September 30, 2024 and the completion of all year-end closing procedures; and the other risks, uncertainties and factors set forth in the Company’s most recent Annual Report on Form 10-K, its subsequent Quarterly Reports on Form 10-Q, its Current Reports on Form 8-K and other reports the Company files with the Securities and Exchange Commission (the “SEC”). Forward-looking statements speak only as of the date they are made. The Company assumes no obligation to update forward-looking statements to reflect actual results, subsequent events, or circumstances or other changes affecting such statements, except to the extent required by applicable law. Use of Non-GAAP Financial Information The Company presents Adjusted EBITDA, Adjusted EBTIDA Margin, Free Cash Flow Conversion, Total Leverage Ratio and Net Leverage Ratio to help the Company describe its operating and financial performance. These financial measures do not conform to accounting principles generally accepted in the United States ( GAAP ), are commonly used in the Company’s industry and have certain limitations and should not be construed as alternatives to Net Income and other income data measures (as determined in accordance with GAAP), or as better indicators of operating performance. These non-GAAP financial measures, as defined by the Company, may not be comparable to similar non-GAAP financial measures presented by other companies. The Company’s presentation of such measures should not be construed as an inference that its future results will be unaffected by unusual or non-recurring items. For additional information regarding the Company's use of non-GAAP financial information, as well as reconciliations of non-GAAP financial measures to the most directly comparable financial measures calculated and presented in accordance with GAAP, please see the appendix to this presentation. Preliminary Financial Results This presentation includes certain preliminary financial information regarding the Company’s fiscal year ended September 30, 2024. The Company’s independent registered public accounting firm has not audited, reviewed, compiled or performed any procedures with respect to such preliminary financial information or its audit of the Company’s financial statements for the fiscal year ended September 30, 2024. The Company’s actual results may differ from these estimates as a result of the Company’s year-end closing procedures, review adjustments and other developments that may arise between now and the time the Company’s financial results for the fiscal year ended September 30, 2024 are finalized. Asphalt Inc., LLC d/b/a Lone Star Paving The information and data relating to LSP contained in this presentation is based on information provided by LSP that we believe is accurate, but we have not independently verified such information. This data is subject to change and may not be reliable. Combined Results The financial information included in this presentation is not intended to comply with the requirements of Regulation S-X under the Securities Act and the rules and regulations of the SEC promulgated thereunder, in particular with respect to the presentation of any pro forma financial information. As a result, the information that the Company files with the SEC at a later date may differ from the information contained in this presentation in order to comply with SEC rules. The combined results contained herein have been prepared by the Company’s management solely based on adding the historical financial statements of the Company and LSP for the applicable periods and have not been prepared or reviewed by any independent accounting firm. The combined results contained herein do not purport to contain all of the information that a prospective investor may desire in evaluating the proposed acquisition of LSP and/or the related transactions. Industry and Market Data This presentation contains statistical and market data that the Company obtained from industry publications, reports generated by third parties, third-party studies, and public filings. Although the Company believes that the publications, reports, studies, and filings are reliable as of the date of this presentation, the Company has not independently verified such statistical or market data. The industry in which the Company operates is subject to a high degree of uncertainty and risk due to a variety of factors. These and other factors could cause results to differ materially from those expressed in these publications and reports. CONFIDENTIAL 1

Management Presenters Jule Smith Greg Hoffman Chief Executive Officer Chief Financial Officer CONFIDENTIAL 2
Today’s Agenda Transaction Overview 1 Construction Partners Overview 2 Lone Star Paving Overview 3 Key Credit Highlights 4 Financial Overview 5 CONFIDENTIAL 3
Transaction Overview CONFIDENTIAL
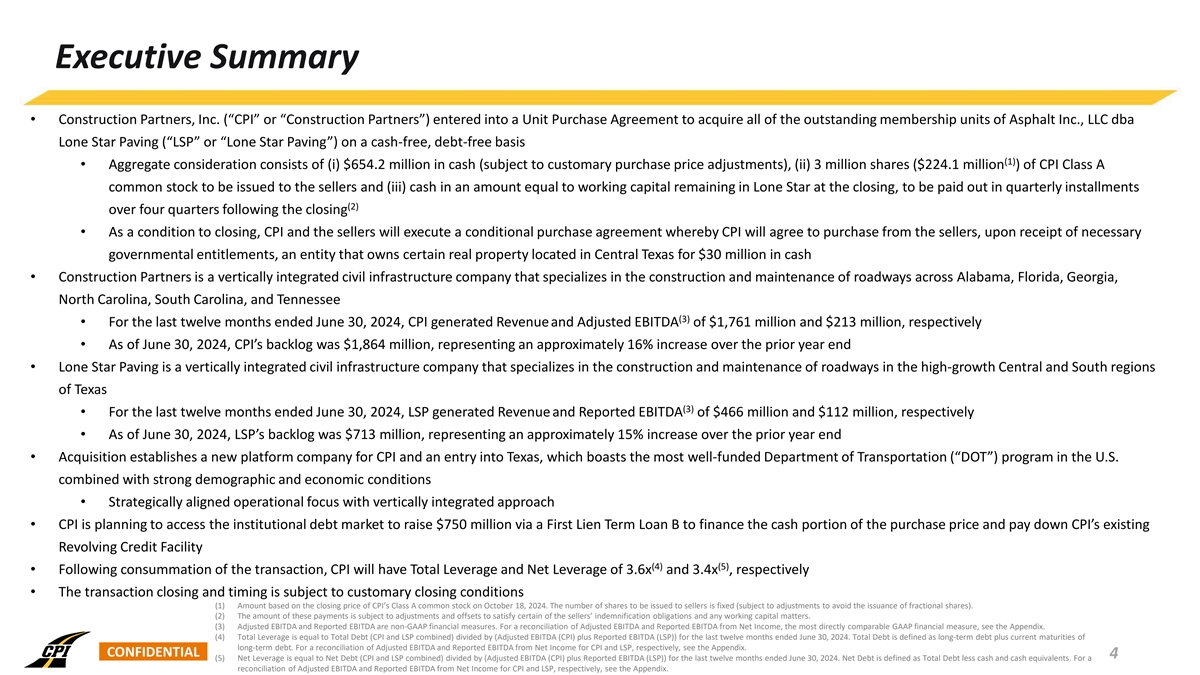
Executive Summary • Construction Partners, Inc. (“CPI” or “Construction Partners”) entered into a Unit Purchase Agreement to acquire all of the outstanding membership units of Asphalt Inc., LLC dba Lone Star Paving (“LSP” or “Lone Star Paving”) on a cash-free, debt-free basis (1) • Aggregate consideration consists of (i) $654.2 million in cash (subject to customary purchase price adjustments), (ii) 3 million shares ($224.1 million ) of CPI Class A common stock to be issued to the sellers and (iii) cash in an amount equal to working capital remaining in Lone Star at the closing, to be paid out in quarterly installments (2) over four quarters following the closing • As a condition to closing, CPI and the sellers will execute a conditional purchase agreement whereby CPI will agree to purchase from the sellers, upon receipt of necessary governmental entitlements, an entity that owns certain real property located in Central Texas for $30 million in cash • Construction Partners is a vertically integrated civil infrastructure company that specializes in the construction and maintenance of roadways across Alabama, Florida, Georgia, North Carolina, South Carolina, and Tennessee (3) • For the last twelve months ended June 30, 2024, CPI generated Revenue and Adjusted EBITDA of $1,761 million and $213 million, respectively • As of June 30, 2024, CPI’s backlog was $1,864 million, representing an approximately 16% increase over the prior year end • Lone Star Paving is a vertically integrated civil infrastructure company that specializes in the construction and maintenance of roadways in the high-growth Central and South regions of Texas (3) • For the last twelve months ended June 30, 2024, LSP generated Revenue and Reported EBITDA of $466 million and $112 million, respectively • As of June 30, 2024, LSP’s backlog was $713 million, representing an approximately 15% increase over the prior year end • Acquisition establishes a new platform company for CPI and an entry into Texas, which boasts the most well-funded Department of Transportation (“DOT”) program in the U.S. combined with strong demographic and economic conditions • Strategically aligned operational focus with vertically integrated approach • CPI is planning to access the institutional debt market to raise $750 million via a First Lien Term Loan B to finance the cash portion of the purchase price and pay down CPI’s existing Revolving Credit Facility (4) (5) • Following consummation of the transaction, CPI will have Total Leverage and Net Leverage of 3.6x and 3.4x , respectively • The transaction closing and timing is subject to customary closing conditions (1) Amount based on the closing price of CPI’s Class A common stock on October 18, 2024. The number of shares to be issued to sellers is fixed (subject to adjustments to avoid the issuance of fractional shares). (2) The amount of these payments is subject to adjustments and offsets to satisfy certain of the sellers’ indemnification obligations and any working capital matters. (3) Adjusted EBITDA and Reported EBITDA are non-GAAP financial measures. For a reconciliation of Adjusted EBITDA and Reported EBITDA from Net Income, the most directly comparable GAAP financial measure, see the Appendix. (4) Total Leverage is equal to Total Debt (CPI and LSP combined) divided by (Adjusted EBITDA (CPI) plus Reported EBITDA (LSP)) for the last twelve months ended June 30, 2024. Total Debt is defined as long-term debt plus current maturities of long-term debt. For a reconciliation of Adjusted EBITDA and Reported EBITDA from Net Income for CPI and LSP, respectively, see the Appendix. CONFIDENTIAL 4 (5) Net Leverage is equal to Net Debt (CPI and LSP combined) divided by (Adjusted EBITDA (CPI) plus Reported EBITDA (LSP)) for the last twelve months ended June 30, 2024. Net Debt is defined as Total Debt less cash and cash equivalents. For a reconciliation of Adjusted EBITDA and Reported EBITDA from Net Income for CPI and LSP, respectively, see the Appendix.
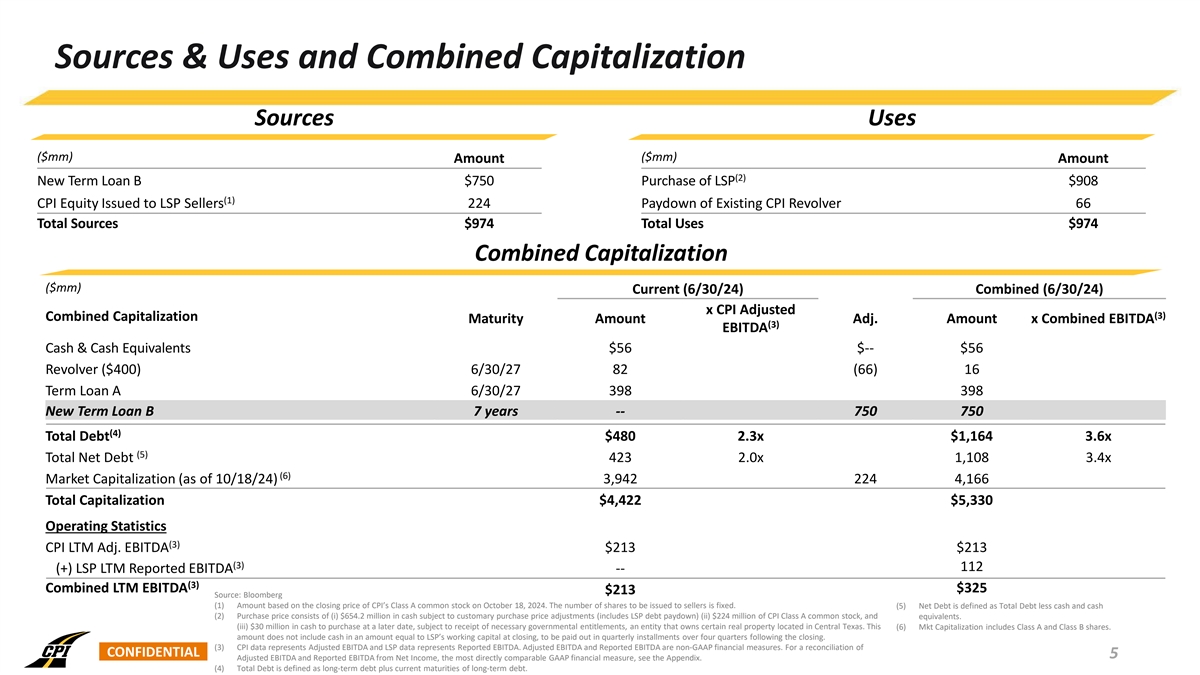
Sources & Uses and Combined Capitalization Sources Uses ($mm) ($mm) Amount Amount (2) New Term Loan B $750 Purchase of LSP $908 (1) CPI Equity Issued to LSP Sellers 224 Paydown of Existing CPI Revolver 66 Total Sources $974 Total Uses $974 Combined Capitalization ($mm) Current (6/30/24) Combined (6/30/24) x CPI Adjusted (3) Combined Capitalization Maturity Amount Adj. Amount x Combined EBITDA (3) EBITDA Cash & Cash Equivalents $56 $-- $56 Revolver ($400) 6/30/27 82 (66) 16 Term Loan A 6/30/27 398 398 New Term Loan B 7 years -- 750 750 (4) Total Debt $480 2.3x $1,164 3.6x (5) Total Net Debt 423 2.0x 1,108 3.4x (6) Market Capitalization (as of 10/18/24) 3,942 224 4,166 Total Capitalization $4,422 $5,330 Operating Statistics (3) CPI LTM Adj. EBITDA $213 $213 (3) 112 (+) LSP LTM Reported EBITDA -- (3) Combined LTM EBITDA $325 $213 Source: Bloomberg (1) Amount based on the closing price of CPI’s Class A common stock on October 18, 2024. The number of shares to be issued to sellers is fixed. (5) Net Debt is defined as Total Debt less cash and cash (2) Purchase price consists of (i) $654.2 million in cash subject to customary purchase price adjustments (includes LSP debt paydown) (ii) $224 million of CPI Class A common stock, and equivalents. (iii) $30 million in cash to purchase at a later date, subject to receipt of necessary governmental entitlements, an entity that owns certain real property located in Central Texas. This (6) Mkt Capitalization includes Class A and Class B shares. amount does not include cash in an amount equal to LSP’s working capital at closing, to be paid out in quarterly installments over four quarters following the closing. (3) CPI data represents Adjusted EBITDA and LSP data represents Reported EBITDA. Adjusted EBITDA and Reported EBITDA are non-GAAP financial measures. For a reconciliation of CONFIDENTIAL 5 Adjusted EBITDA and Reported EBITDA from Net Income, the most directly comparable GAAP financial measure, see the Appendix. (4) Total Debt is defined as long-term debt plus current maturities of long-term debt.
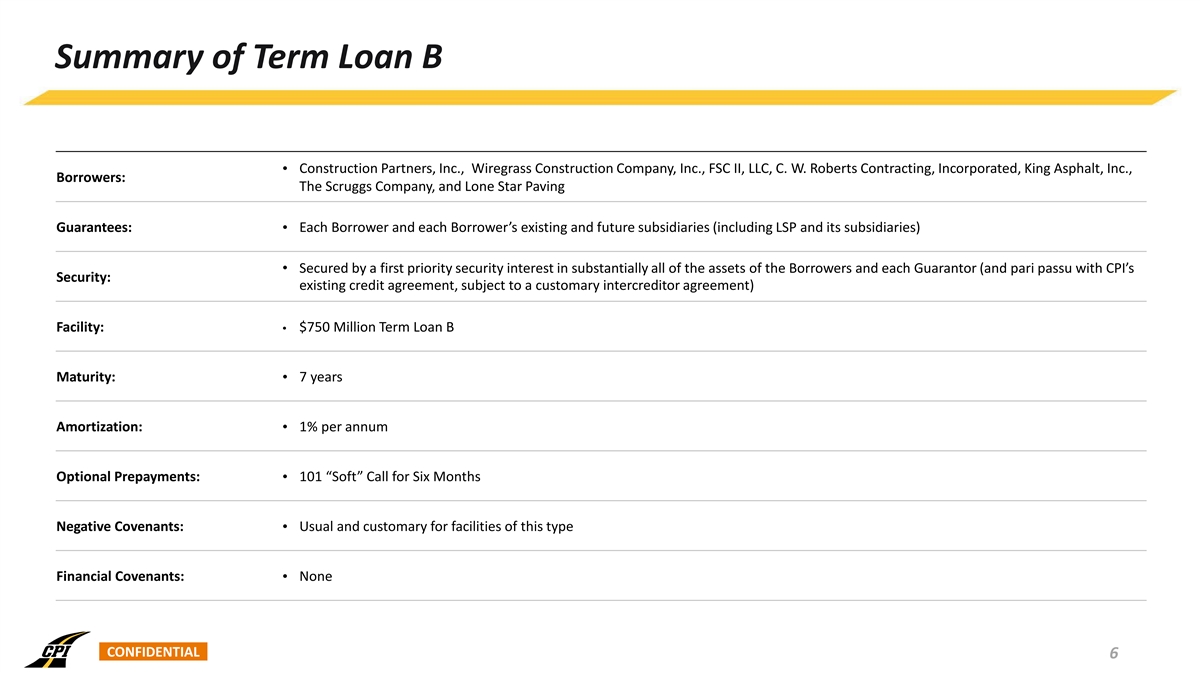
Summary of Term Loan B • Construction Partners, Inc., Wiregrass Construction Company, Inc., FSC II, LLC, C. W. Roberts Contracting, Incorporated, King Asphalt, Inc., Borrowers: The Scruggs Company, and Lone Star Paving Guarantees: • Each Borrower and each Borrower’s existing and future subsidiaries (including LSP and its subsidiaries) • Secured by a first priority security interest in substantially all of the assets of the Borrowers and each Guarantor (and pari passu with CPI’s Security: existing credit agreement, subject to a customary intercreditor agreement) Facility: $750 Million Term Loan B • Maturity: 7 years • Amortization: 1% per annum • Optional Prepayments: • 101 “Soft” Call for Six Months Negative Covenants: • Usual and customary for facilities of this type Financial Covenants: • None CONFIDENTIAL 6
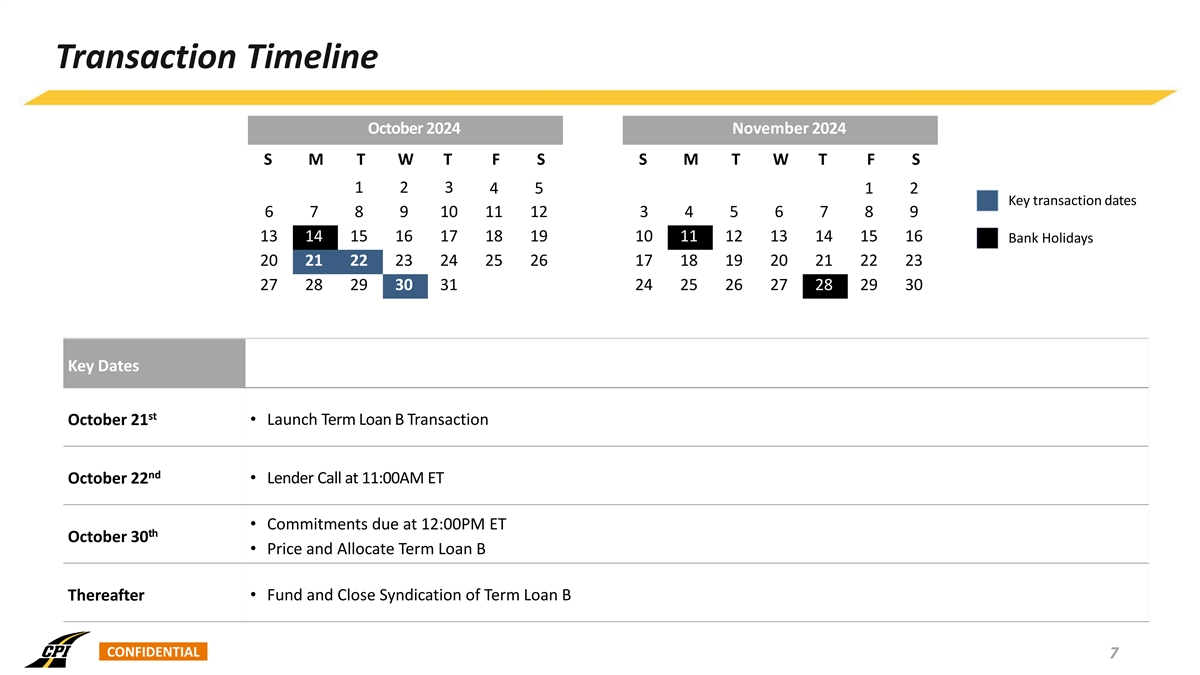
Transaction Timeline October 2024 November 2024 S M T W T F S S M T W T F S 1 2 3 4 5 1 2 Key transaction dates 6 7 8 9 10 11 12 3 4 5 6 7 8 9 13 14 15 16 17 18 19 10 11 12 13 14 15 16 Bank Holidays 20 21 22 23 24 25 26 17 18 19 20 21 22 23 27 28 29 30 31 24 25 26 27 28 29 30 Key Dates Events st October 21 • Launch Term Loan B Transaction nd October 22 • Lender Call at 11:00AM ET • Commitments due at 12:00PM ET th October 30 • Price and Allocate Term Loan B • Fund and Close Syndication of Term Loan B Thereafter CONFIDENTIAL 7

Construction Partners Overview CONFIDENTIAL
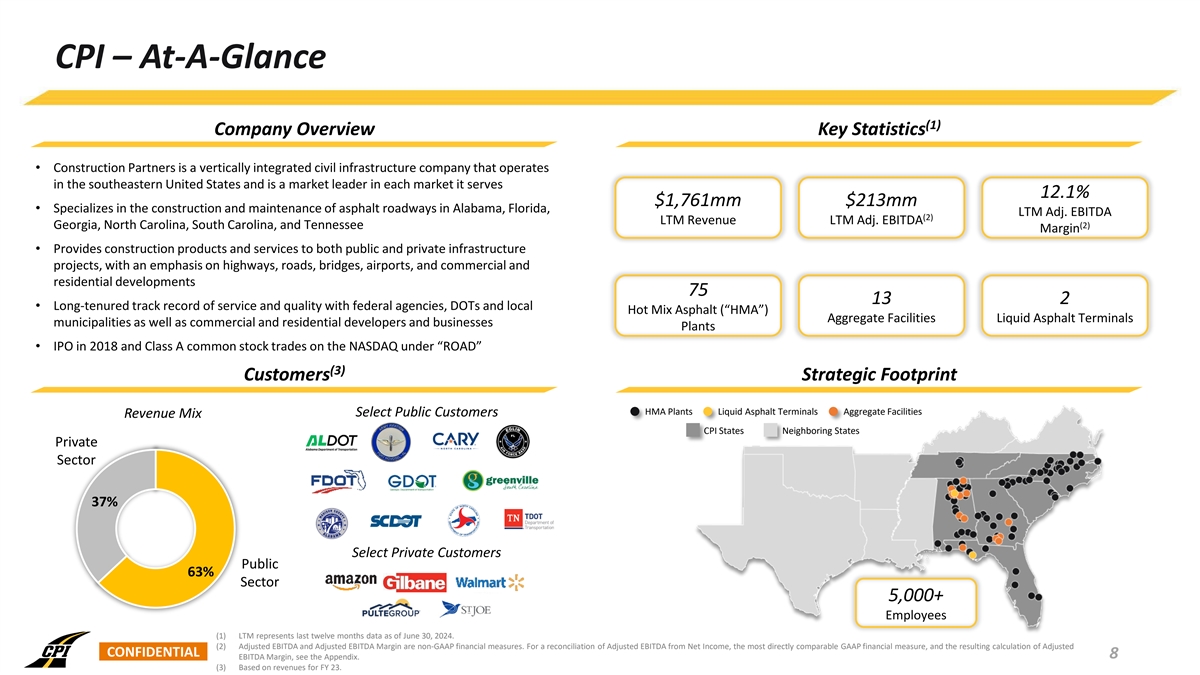
CPI – At-A-Glance (1) Company Overview Key Statistics • Construction Partners is a vertically integrated civil infrastructure company that operates in the southeastern United States and is a market leader in each market it serves 12.1% $1,761mm $213mm • Specializes in the construction and maintenance of asphalt roadways in Alabama, Florida, LTM Adj. EBITDA (2) LTM Revenue LTM Adj. EBITDA Georgia, North Carolina, South Carolina, and Tennessee (2) Margin • Provides construction products and services to both public and private infrastructure projects, with an emphasis on highways, roads, bridges, airports, and commercial and residential developments 75 13 2 • Long-tenured track record of service and quality with federal agencies, DOTs and local Hot Mix Asphalt (“HMA”) Aggregate Facilities Liquid Asphalt Terminals municipalities as well as commercial and residential developers and businesses Plants • IPO in 2018 and Class A common stock trades on the NASDAQ under “ROAD” (3) Customers Strategic Footprint HMA Plants Liquid Asphalt Terminals Aggregate Facilities Select Public Customers Revenue Mix CPI States Neighboring States Private Sector 37% Select Private Customers Public 63% Sector 5,000+ Employees (1) LTM represents last twelve months data as of June 30, 2024. (2) Adjusted EBITDA and Adjusted EBITDA Margin are non-GAAP financial measures. For a reconciliation of Adjusted EBITDA from Net Income, the most directly comparable GAAP financial measure, and the resulting calculation of Adjusted CONFIDENTIAL 8 EBITDA Margin, see the Appendix. (3) Based on revenues for FY 23.
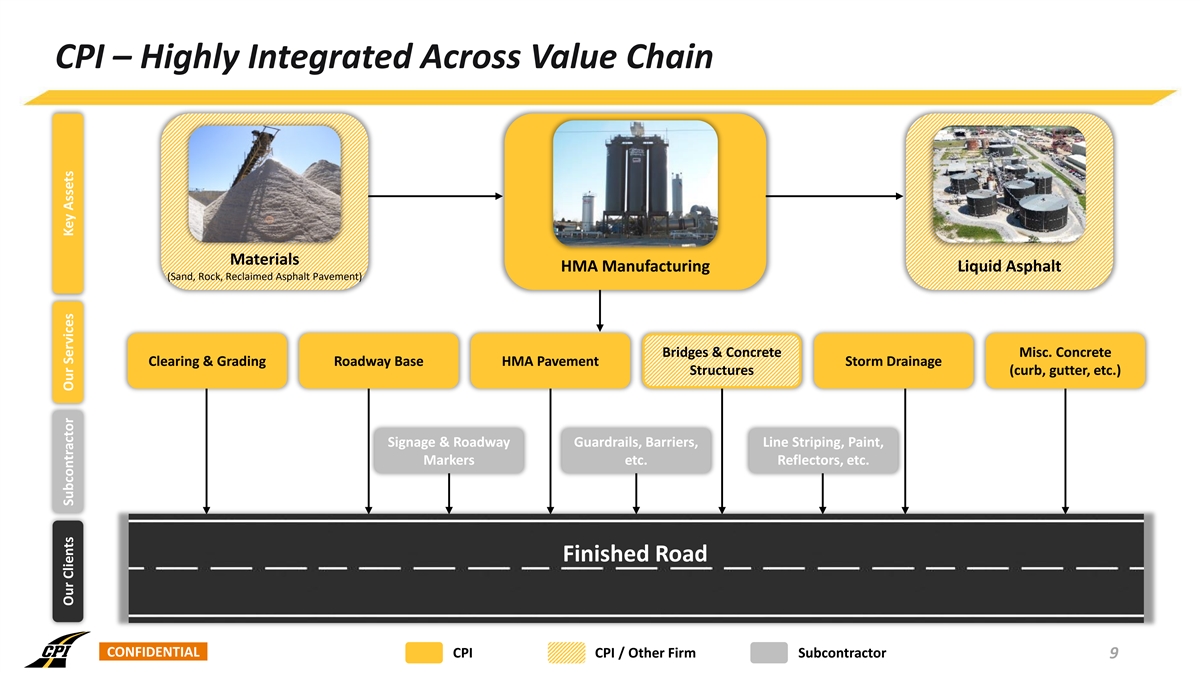
CPI – Highly Integrated Across Value Chain Materials HMA Manufacturing Liquid Asphalt (Sand, Rock, Reclaimed Asphalt Pavement) Bridges & Concrete Misc. Concrete Clearing & Grading Roadway Base HMA Pavement Storm Drainage Structures (curb, gutter, etc.) Signage & Roadway Guardrails, Barriers, Line Striping, Paint, Markers etc. Reflectors, etc. Finished Road CONFIDENTIAL CPI CPI / Other Firm Subcontractor 9 Our Clients Subcontractor Our Services Key Assets
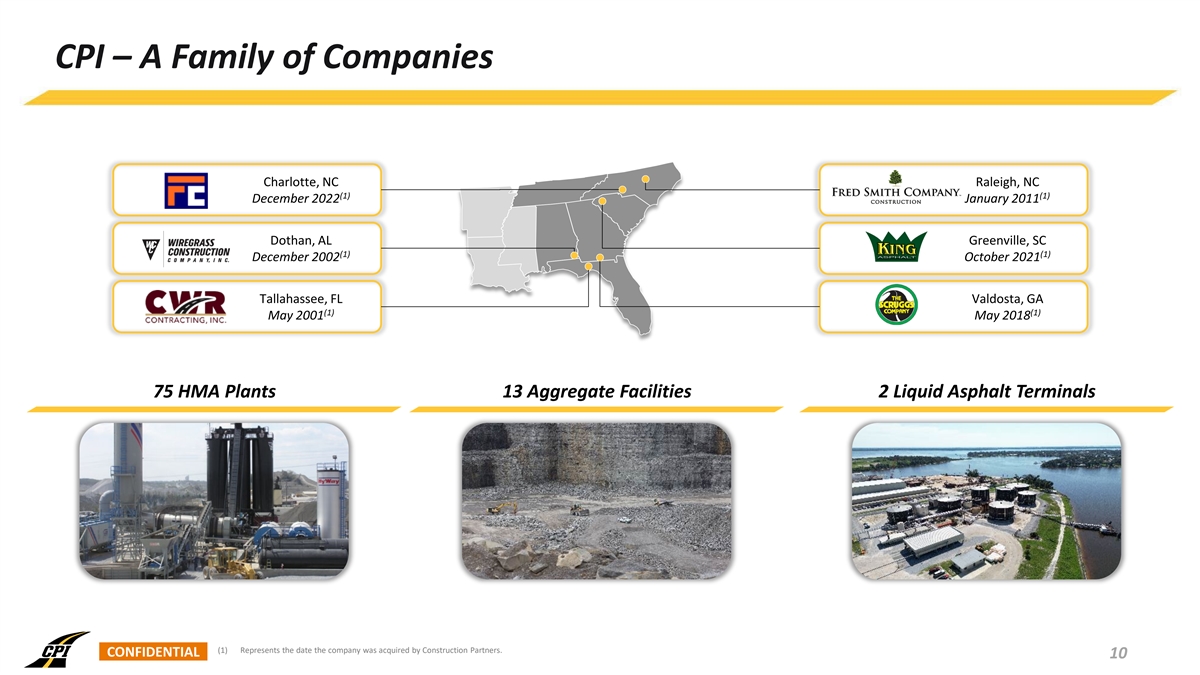
CPI – A Family of Companies Charlotte, NC Raleigh, NC (1) (1) December 2022 January 2011 Dothan, AL Greenville, SC (1) (1) December 2002 October 2021 Tallahassee, FL Valdosta, GA (1) (1) May 2001 May 2018 75 HMA Plants 13 Aggregate Facilities 2 Liquid Asphalt Terminals (1) Represents the date the company was acquired by Construction Partners. CONFIDENTIAL 10
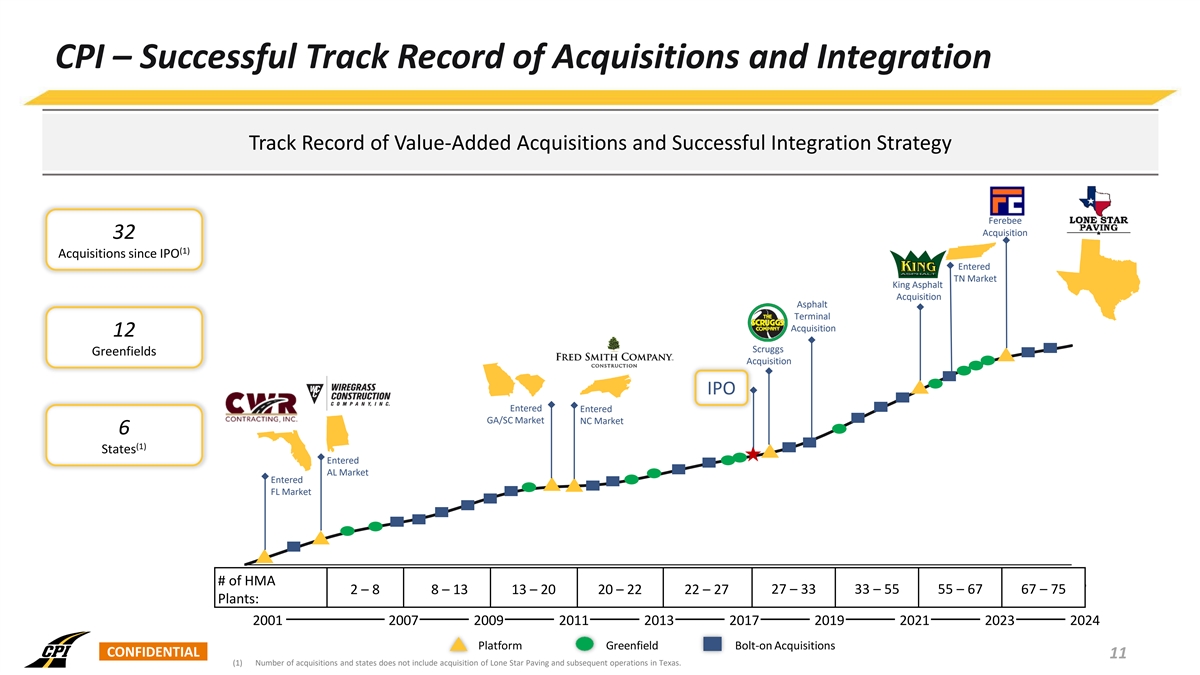
CPI – Successful Track Record of Acquisitions and Integration Track Record of Value-Added Acquisitions and Successful Integration Strategy Ferebee Acquisition 32 (1) Acquisitions since IPO Entered TN Market King Asphalt Acquisition Asphalt Terminal Acquisition 12 Scruggs Greenfields Acquisition IPO Entered Entered GA/SC Market NC Market 6 (1) States Entered AL Market Entered FL Market # of HMA 2001 2007 2009 2011 2013 2017 2019 2021 2023 2025 2 – 8 8 – 13 13 – 20 20 – 22 22 – 27 27 – 33 33 – 55 55 – 67 67 – 75 Plants: 2001 2007 2009 2011 2013 2017 2019 2021 2023 2024 Platform Greenfield Bolt-on Acquisitions CONFIDENTIAL 11 (1) Number of acquisitions and states does not include acquisition of Lone Star Paving and subsequent operations in Texas.
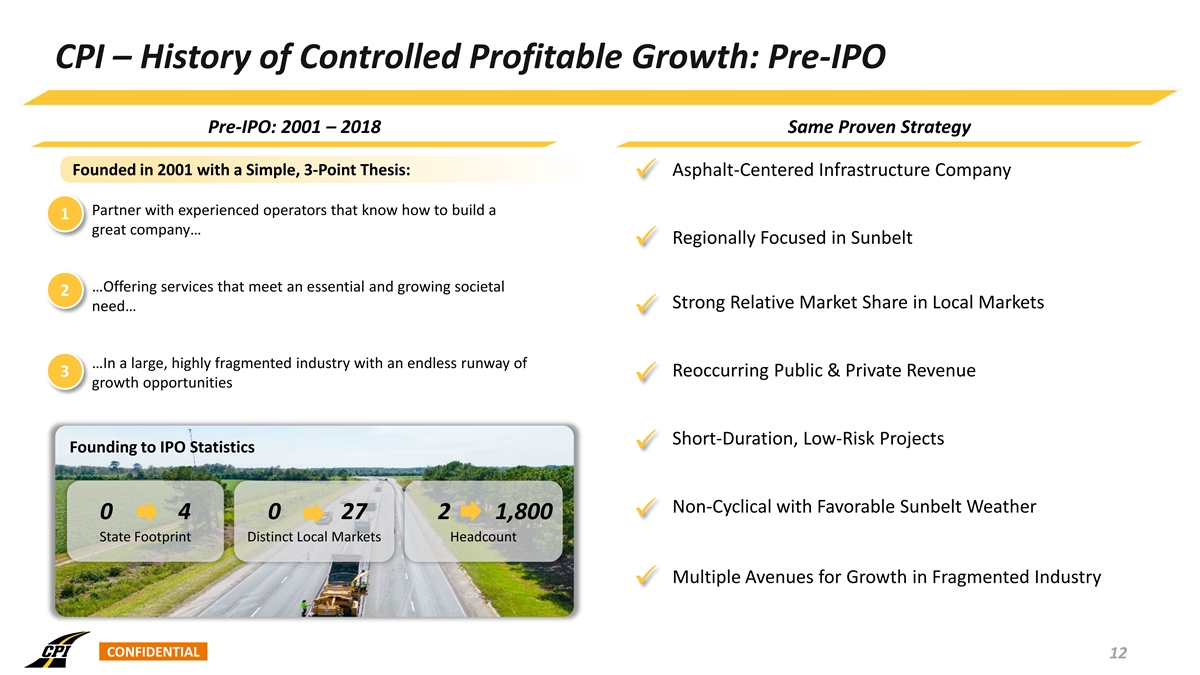
CPI – History of Controlled Profitable Growth: Pre-IPO Pre-IPO: 2001 – 2018 Same Proven Strategy Founded in 2001 with a Simple, 3-Point Thesis: Asphalt-Centered Infrastructure Company ü 1) Partner with experienced operators that know how to build a 1 great company… Regionally Focused in Sunbelt ü 2) …Offering services that meet an essential and growing societal 2 Strong Relative Market Share in Local Markets need… ü 3) …In a large, highly fragmented industry with an endless runway of Reoccurring Public & Private Revenue 3 ü growth opportunities Short-Duration, Low-Risk Projects Founding to IPO Statisticsü Non-Cyclical with Favorable Sunbelt Weather 0 4 0 27 2 1,800 ü State Footprint Distinct Local Markets Headcount Multiple Avenues for Growth in Fragmented Industry ü CONFIDENTIAL 12
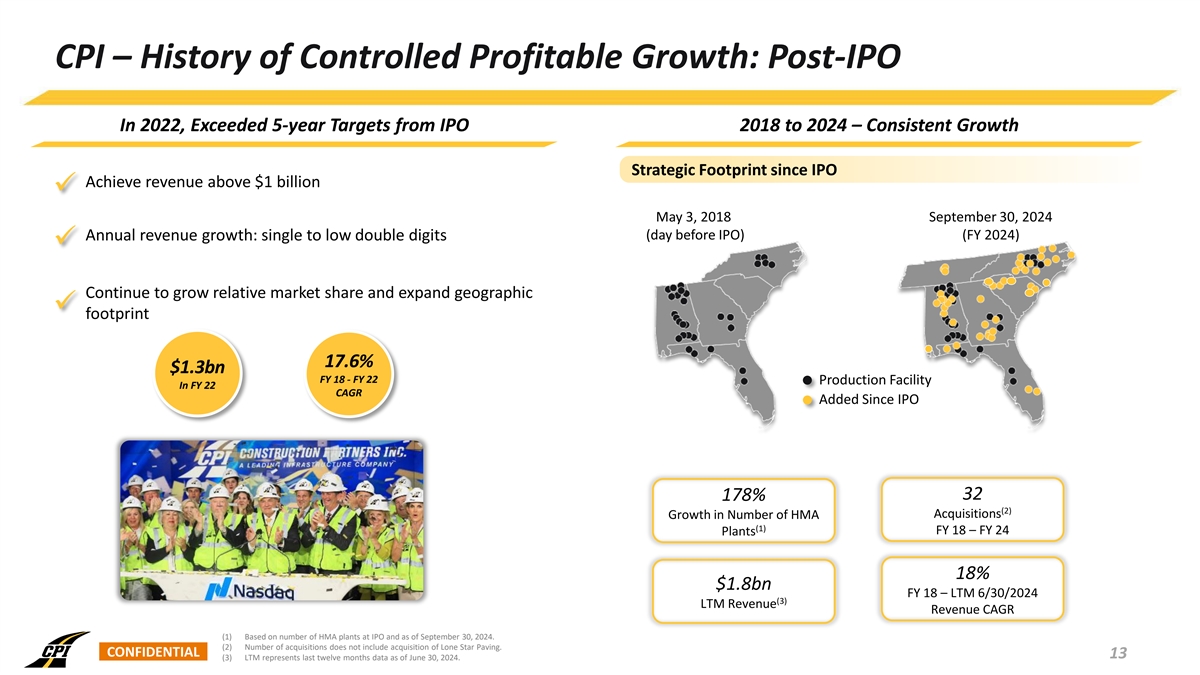
CPI – History of Controlled Profitable Growth: Post-IPO In 2022, Exceeded 5-year Targets from IPO 2018 to 2024 – Consistent Growth Strategic Footprint since IPO Achieve revenue above $1 billion ü May 3, 2018 September 30, 2024 (day before IPO) (FY 2024) Annual revenue growth: single to low double digits ü Continue to grow relative market share and expand geographic ü footprint 17.6% $1.3bn FY 18 - FY 22 Production Facility In FY 22 CAGR Added Since IPO 32 178% (2) Acquisitions Growth in Number of HMA (1) FY 18 – FY 24 Plants 18% $1.8bn FY 18 – LTM 6/30/2024 (3) LTM Revenue Revenue CAGR (1) Based on number of HMA plants at IPO and as of September 30, 2024. (2) Number of acquisitions does not include acquisition of Lone Star Paving. CONFIDENTIAL 13 (3) LTM represents last twelve months data as of June 30, 2024.
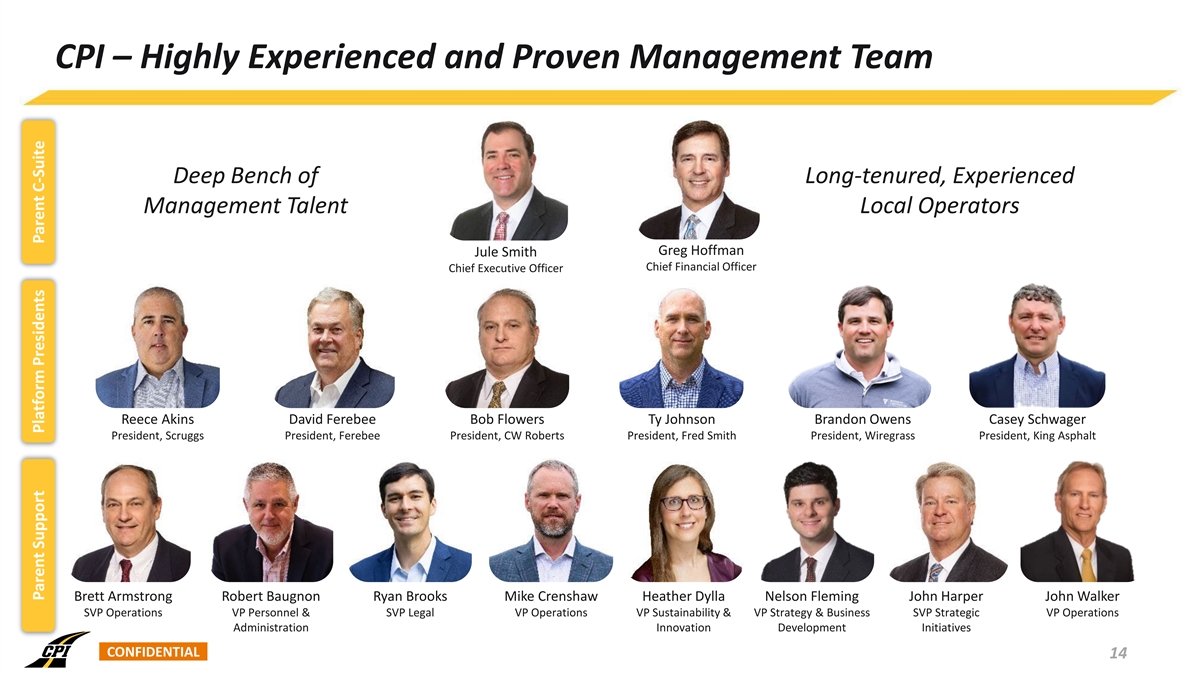
CPI – Highly Experienced and Proven Management Team Deep Bench of Long-tenured, Experienced Management Talent Local Operators Greg Hoffman Jule Smith Chief Financial Officer Chief Executive Officer Reece Akins David Ferebee Bob Flowers Ty Johnson Brandon Owens Casey Schwager President, Scruggs President, Ferebee President, CW Roberts President, Fred Smith President, Wiregrass President, King Asphalt Brett Armstrong Robert Baugnon Ryan Brooks Mike Crenshaw Heather Dylla Nelson Fleming John Harper John Walker SVP Operations VP Personnel & SVP Legal VP Operations VP Sustainability & VP Strategy & Business SVP Strategic VP Operations 36 36 Page 17 Administration Innovation Development Initiatives CONFIDENTIAL 14 Parent Support Platform Presidents Parent C-Suite
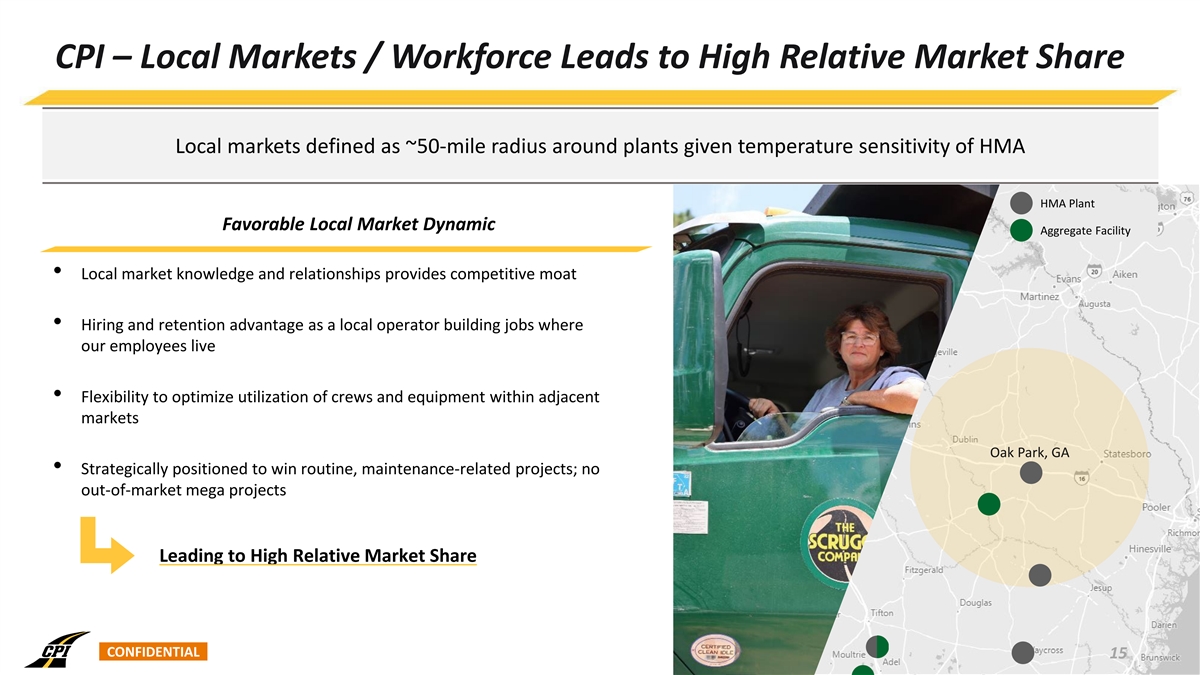
CPI – Local Markets / Workforce Leads to High Relative Market Share Local markets defined as ~50-mile radius around plants given temperature sensitivity of HMA HMA Plant Favorable Local Market Dynamic Aggregate Facility • Local market knowledge and relationships provides competitive moat • Hiring and retention advantage as a local operator building jobs where our employees live • Flexibility to optimize utilization of crews and equipment within adjacent markets Oak Park, GA • Strategically positioned to win routine, maintenance-related projects; no out-of-market mega projects Leading to High Relative Market Share CONFIDENTIAL 15
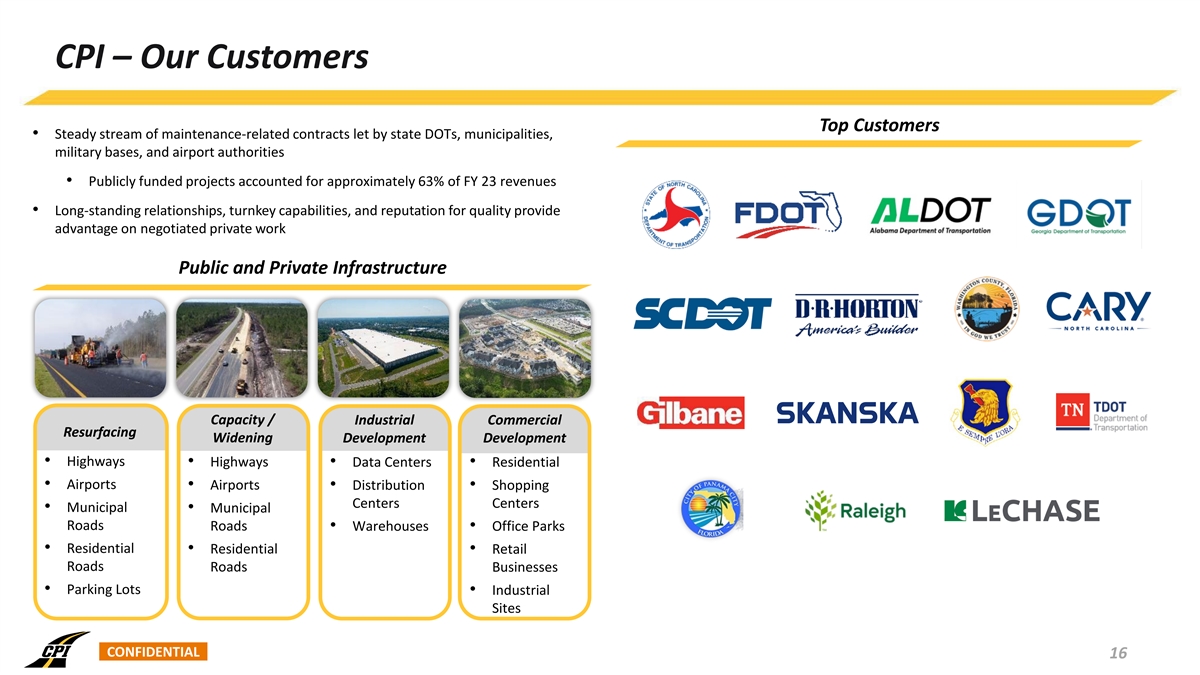
CPI – Our Customers Top Customers • Steady stream of maintenance-related contracts let by state DOTs, municipalities, military bases, and airport authorities • Publicly funded projects accounted for approximately 63% of FY 23 revenues • Long-standing relationships, turnkey capabilities, and reputation for quality provide advantage on negotiated private work Public and Private Infrastructure Capacity / Industrial Commercial Resurfacing Widening Development Development • Highways • Highways • Data Centers • Residential • Airports • Airports • Distribution • Shopping Centers Centers • Municipal • Municipal Roads Roads • Warehouses • Office Parks • Residential • Residential • Retail Roads Roads Businesses • Parking Lots • Industrial Sites CONFIDENTIAL 16
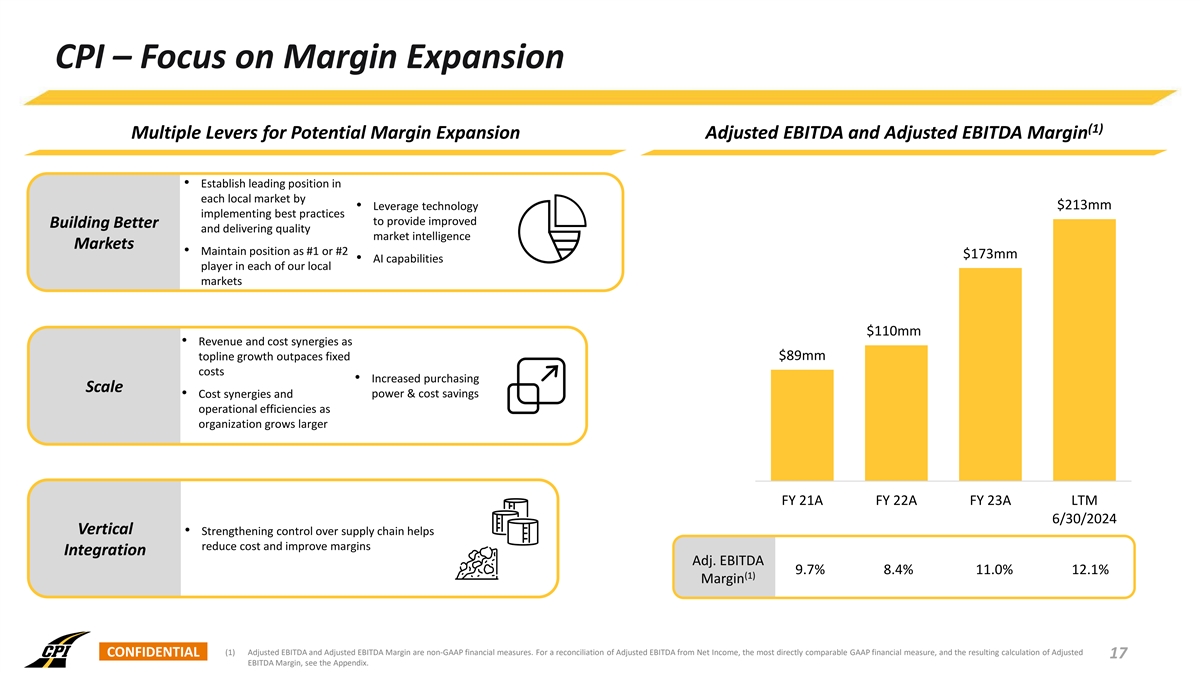
CPI – Focus on Margin Expansion (1) Multiple Levers for Potential Margin Expansion Adjusted EBITDA and Adjusted EBITDA Margin • Establish leading position in each local market by • Leverage technology $213mm implementing best practices to provide improved Building Better and delivering quality market intelligence Markets • Maintain position as #1 or #2 $173mm • AI capabilities player in each of our local markets $110mm • Revenue and cost synergies as topline growth outpaces fixed $89mm costs • Increased purchasing Scale • Cost synergies and power & cost savings operational efficiencies as organization grows larger FY 21A FY 22A FY 23A LTM 6/30/2024 Vertical • Strengthening control over supply chain helps reduce cost and improve margins Integration Adj. EBITDA 9.7% 8.4% 11.0% 12.1% (1) Margin (1) Adjusted EBITDA and Adjusted EBITDA Margin are non-GAAP financial measures. For a reconciliation of Adjusted EBITDA from Net Income, the most directly comparable GAAP financial measure, and the resulting calculation of Adjusted CONFIDENTIAL 17 EBITDA Margin, see the Appendix.
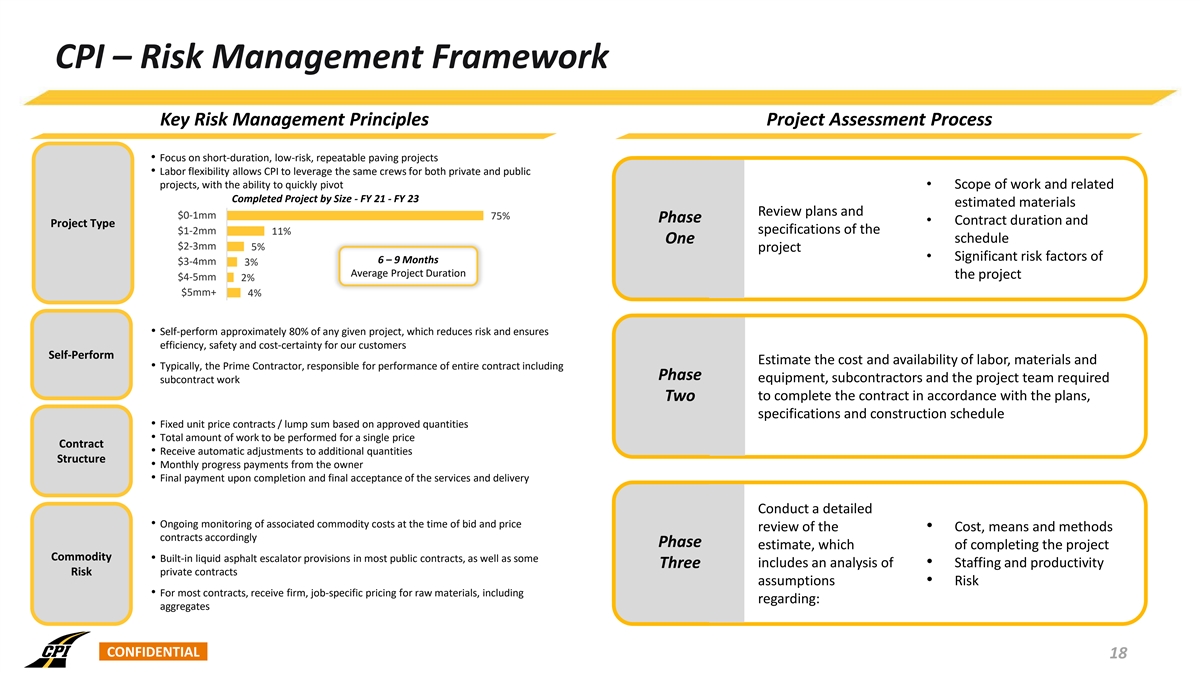
CPI – Risk Management Framework Key Risk Management Principles Project Assessment Process • Focus on short-duration, low-risk, repeatable paving projects • Labor flexibility allows CPI to leverage the same crews for both private and public projects, with the ability to quickly pivot • Scope of work and related Completed Project by Size - FY 21 - FY 23 estimated materials Review plans and $0-1mm 75% Phase • Contract duration and Project Type $1-2mm specifications of the 11% schedule One $2-3mm 5% project • Significant risk factors of 6 – 9 Months $3-4mm 3% Average Project Duration the project $4-5mm 2% $5mm+ 4% • Self-perform approximately 80% of any given project, which reduces risk and ensures efficiency, safety and cost-certainty for our customers Self-Perform Estimate the cost and availability of labor, materials and • Typically, the Prime Contractor, responsible for performance of entire contract including Phase equipment, subcontractors and the project team required subcontract work to complete the contract in accordance with the plans, Two specifications and construction schedule • Fixed unit price contracts / lump sum based on approved quantities • Total amount of work to be performed for a single price Contract • Receive automatic adjustments to additional quantities Structure • Monthly progress payments from the owner • Final payment upon completion and final acceptance of the services and delivery Conduct a detailed • Ongoing monitoring of associated commodity costs at the time of bid and price review of the • Cost, means and methods contracts accordingly Phase estimate, which of completing the project Commodity • Built-in liquid asphalt escalator provisions in most public contracts, as well as some includes an analysis of • Staffing and productivity Three private contracts Risk assumptions • Risk • For most contracts, receive firm, job-specific pricing for raw materials, including regarding: aggregates CONFIDENTIAL 18

Lone Star Paving Overview CONFIDENTIAL
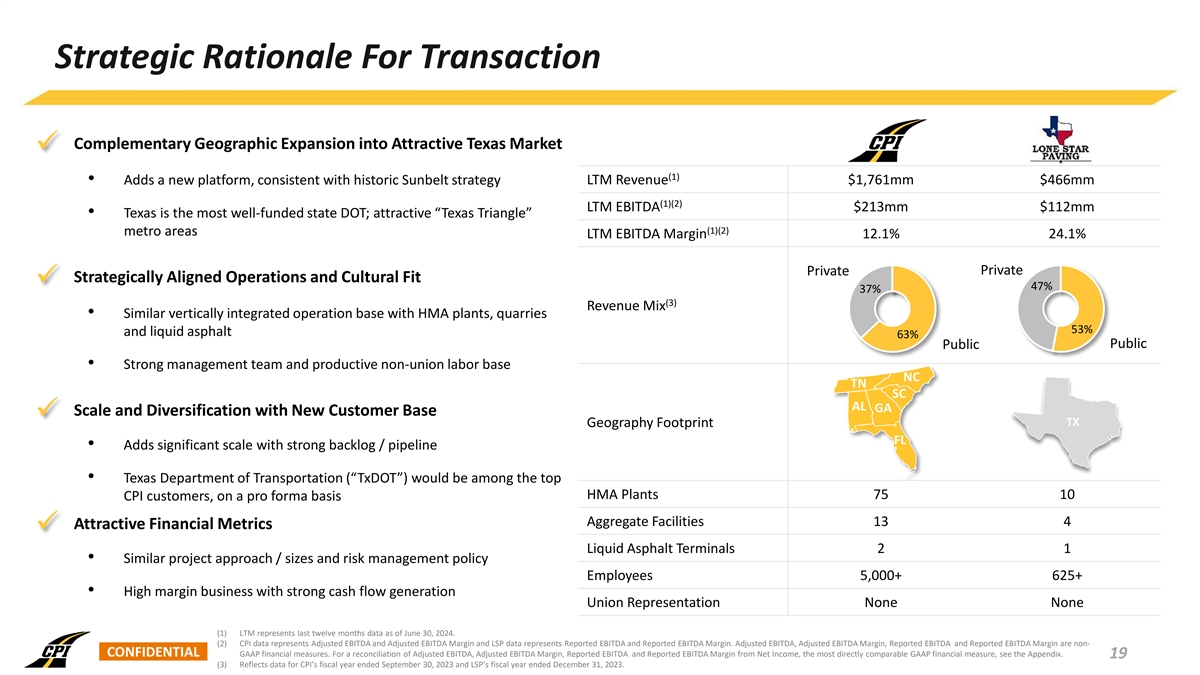
Strategic Rationale For Transaction Complementary Geographic Expansion into Attractive Texas Market ü (1) • Adds a new platform, consistent with historic Sunbelt strategy LTM Revenue $1,761mm $466mm (1)(2) LTM EBITDA $213mm $112mm • Texas is the most well-funded state DOT; attractive “Texas Triangle” (1)(2) metro areas LTM EBITDA Margin 12.1% 24.1% Private Private Strategically Aligned Operations and Cultural Fit ü 47% 37% (3) Revenue Mix • Similar vertically integrated operation base with HMA plants, quarries 53% and liquid asphalt 63% Public Public • Strong management team and productive non-union labor base NC TN SC AL GA Scale and Diversification with New Customer Base ü TX Geography Footprint FL • Adds significant scale with strong backlog / pipeline • Texas Department of Transportation (“TxDOT”) would be among the top HMA Plants 75 10 CPI customers, on a pro forma basis Aggregate Facilities 13 4 Attractive Financial Metrics ü Liquid Asphalt Terminals 2 1 • Similar project approach / sizes and risk management policy Employees 5,000+ 625+ • High margin business with strong cash flow generation Union Representation None None (1) LTM represents last twelve months data as of June 30, 2024. (2) CPI data represents Adjusted EBITDA and Adjusted EBITDA Margin and LSP data represents Reported EBITDA and Reported EBITDA Margin. Adjusted EBITDA, Adjusted EBITDA Margin, Reported EBITDA and Reported EBITDA Margin are non- CONFIDENTIAL GAAP financial measures. For a reconciliation of Adjusted EBITDA, Adjusted EBITDA Margin, Reported EBITDA and Reported EBITDA Margin from Net Income, the most directly comparable GAAP financial measure, see the Appendix. 19 (3) Reflects data for CPI’s fiscal year ended September 30, 2023 and LSP’s fiscal year ended December 31, 2023.
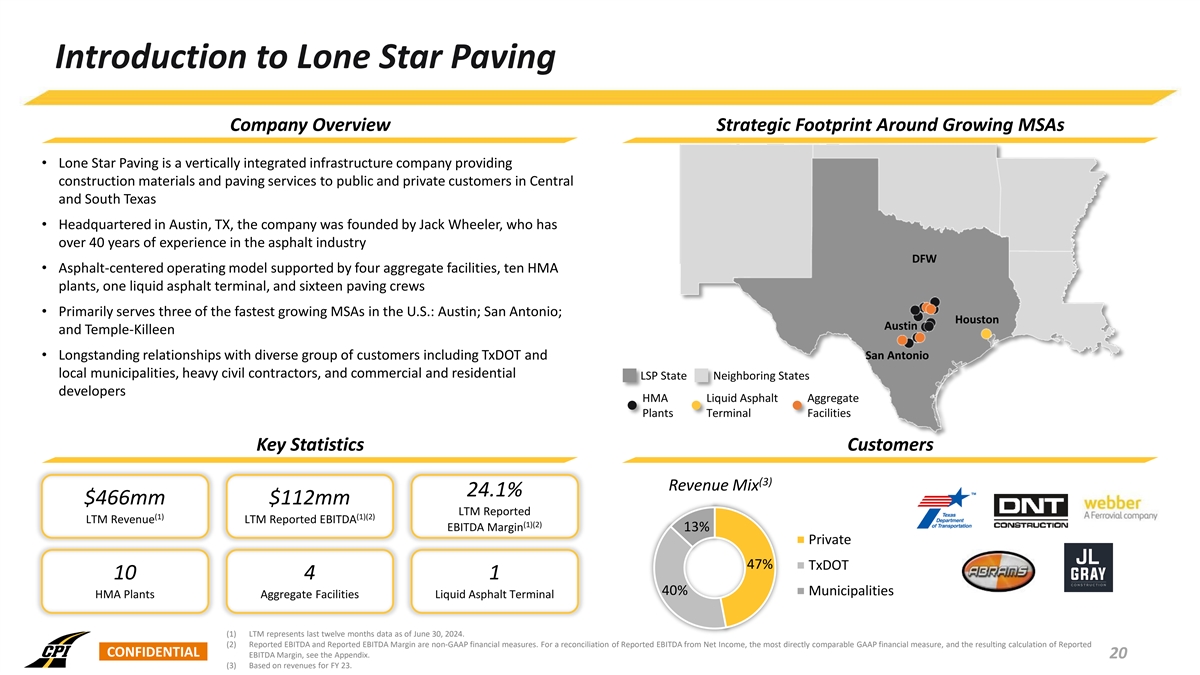
Introduction to Lone Star Paving Company Overview Strategic Footprint Around Growing MSAs • Lone Star Paving is a vertically integrated infrastructure company providing construction materials and paving services to public and private customers in Central and South Texas • Headquartered in Austin, TX, the company was founded by Jack Wheeler, who has over 40 years of experience in the asphalt industry DFW • Asphalt-centered operating model supported by four aggregate facilities, ten HMA plants, one liquid asphalt terminal, and sixteen paving crews • Primarily serves three of the fastest growing MSAs in the U.S.: Austin; San Antonio; Houston Austin and Temple-Killeen • Longstanding relationships with diverse group of customers including TxDOT and San Antonio local municipalities, heavy civil contractors, and commercial and residential LSP State Neighboring States developers HMA Liquid Asphalt Aggregate Plants Terminal Facilities Key Statistics Customers (3) Revenue Mix 24.1% $466mm $112mm LTM Reported (1) (1)(2) LTM Revenue LTM Reported EBITDA (1)(2) EBITDA Margin 13% Private 47% TxDOT 10 4 1 40% Municipalities HMA Plants Aggregate Facilities Liquid Asphalt Terminal (1) LTM represents last twelve months data as of June 30, 2024. (2) Reported EBITDA and Reported EBITDA Margin are non-GAAP financial measures. For a reconciliation of Reported EBITDA from Net Income, the most directly comparable GAAP financial measure, and the resulting calculation of Reported CONFIDENTIAL EBITDA Margin, see the Appendix. 20 (3) Based on revenues for FY 23.
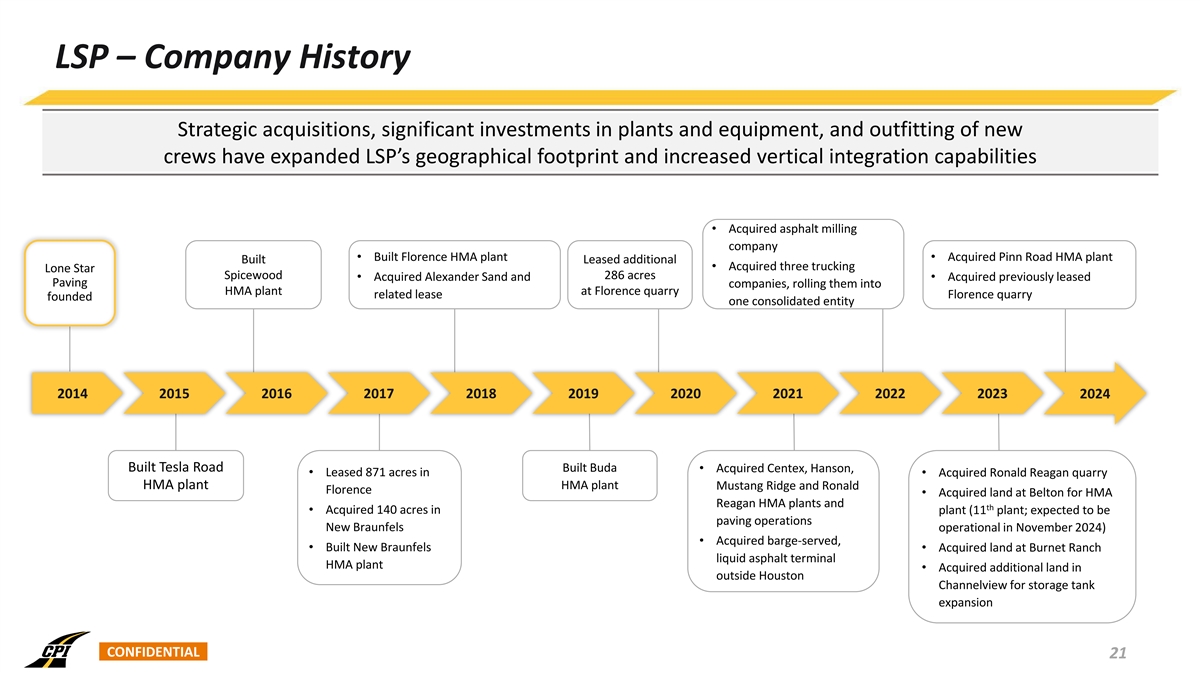
LSP – Company History Strategic acquisitions, significant investments in plants and equipment, and outfitting of new crews have expanded LSP’s geographical footprint and increased vertical integration capabilities • Acquired asphalt milling company • Built Florence HMA plant • Acquired Pinn Road HMA plant Built Leased additional • Acquired three trucking Lone Star Spicewood 286 acres • Acquired Alexander Sand and • Acquired previously leased Paving companies, rolling them into HMA plant at Florence quarry related lease Florence quarry founded one consolidated entity 2014 2015 2016 2017 2018 2019 2020 2021 2022 2023 2024 Built Tesla Road Built Buda • Acquired Centex, Hanson, • Leased 871 acres in • Acquired Ronald Reagan quarry HMA plant HMA plant Mustang Ridge and Ronald Florence • Acquired land at Belton for HMA Reagan HMA plants and th • Acquired 140 acres in plant (11 plant; expected to be paving operations New Braunfels operational in November 2024) • Acquired barge-served, • Built New Braunfels • Acquired land at Burnet Ranch liquid asphalt terminal HMA plant • Acquired additional land in outside Houston Channelview for storage tank expansion CONFIDENTIAL 21
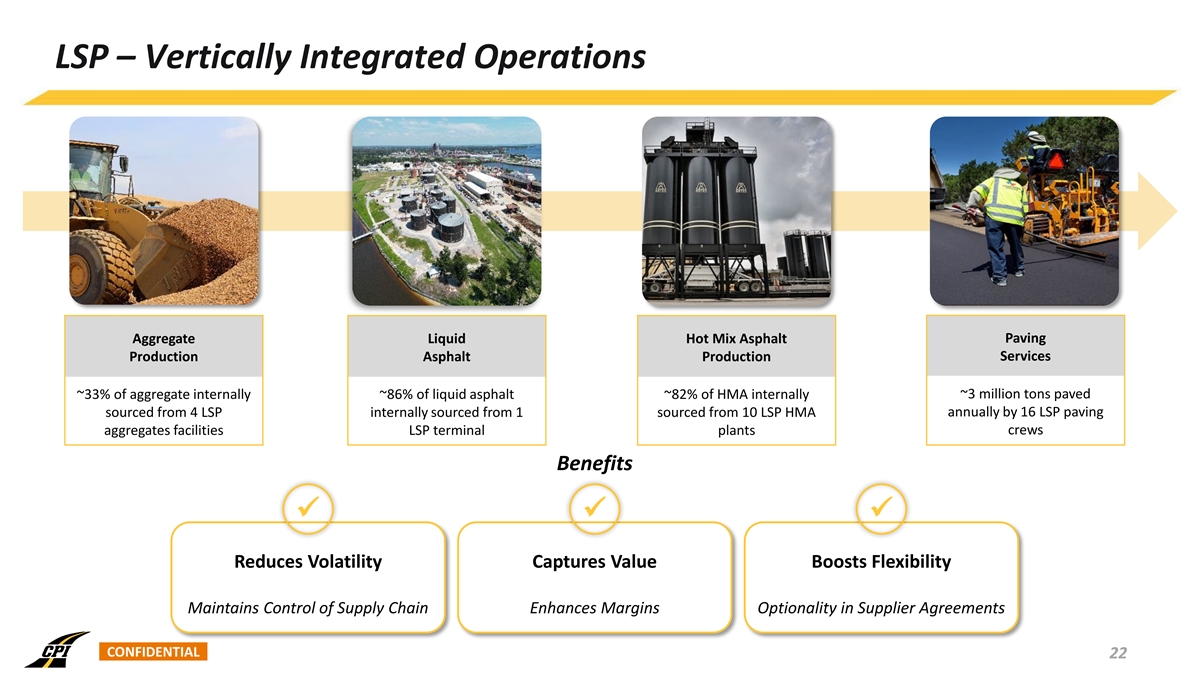
LSP – Vertically Integrated Operations Paving Aggregate Liquid Hot Mix Asphalt Production Asphalt Production Services ~33% of aggregate internally ~86% of liquid asphalt ~82% of HMA internally ~3 million tons paved annually by 16 LSP paving sourced from 4 LSP internally sourced from 1 sourced from 10 LSP HMA aggregates facilities LSP terminal plants crews Benefits üüü Reduces Volatility Captures Value Boosts Flexibility Maintains Control of Supply Chain Enhances Margins Optionality in Supplier Agreements CONFIDENTIAL 22
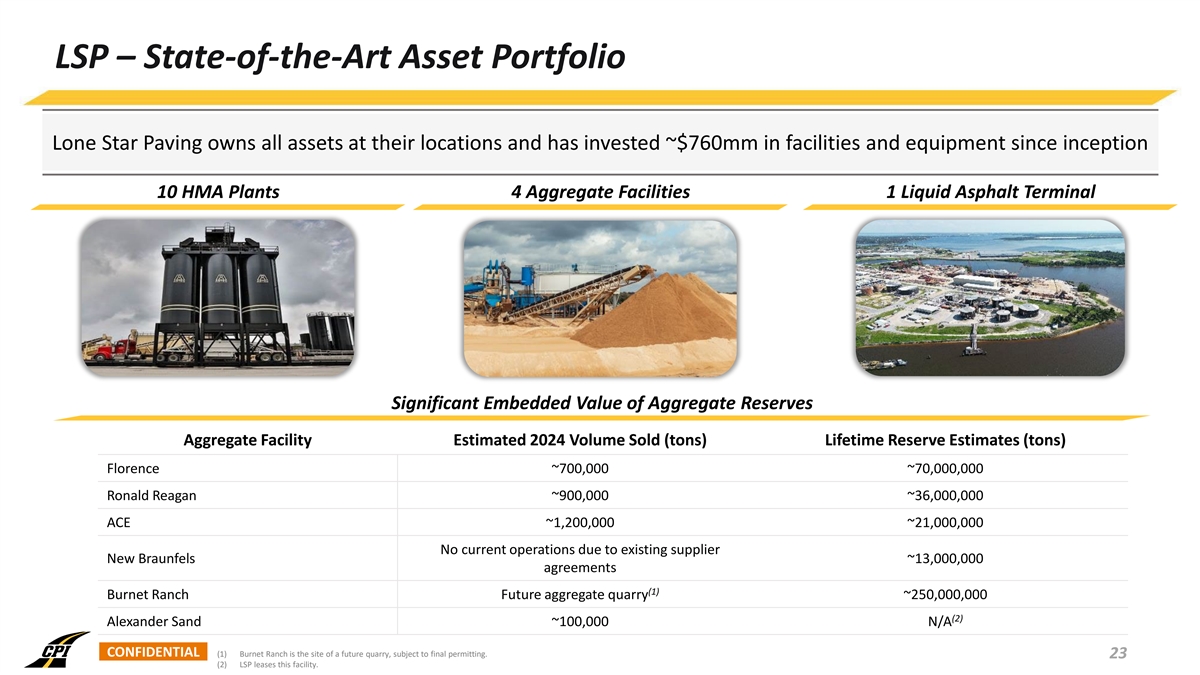
LSP – State-of-the-Art Asset Portfolio Lone Star Paving owns all assets at their locations and has invested ~$760mm in facilities and equipment since inception 10 HMA Plants 4 Aggregate Facilities 1 Liquid Asphalt Terminal Significant Embedded Value of Aggregate Reserves Aggregate Facility Estimated 2024 Volume Sold (tons) Lifetime Reserve Estimates (tons) Florence ~700,000 ~70,000,000 Ronald Reagan ~900,000 ~36,000,000 ACE ~1,200,000 ~21,000,000 No current operations due to existing supplier New Braunfels ~13,000,000 agreements (1) Burnet Ranch Future aggregate quarry ~250,000,000 (2) Alexander Sand ~100,000 N/A CONFIDENTIAL (1) Burnet Ranch is the site of a future quarry, subject to final permitting. 23 (2) LSP leases this facility.
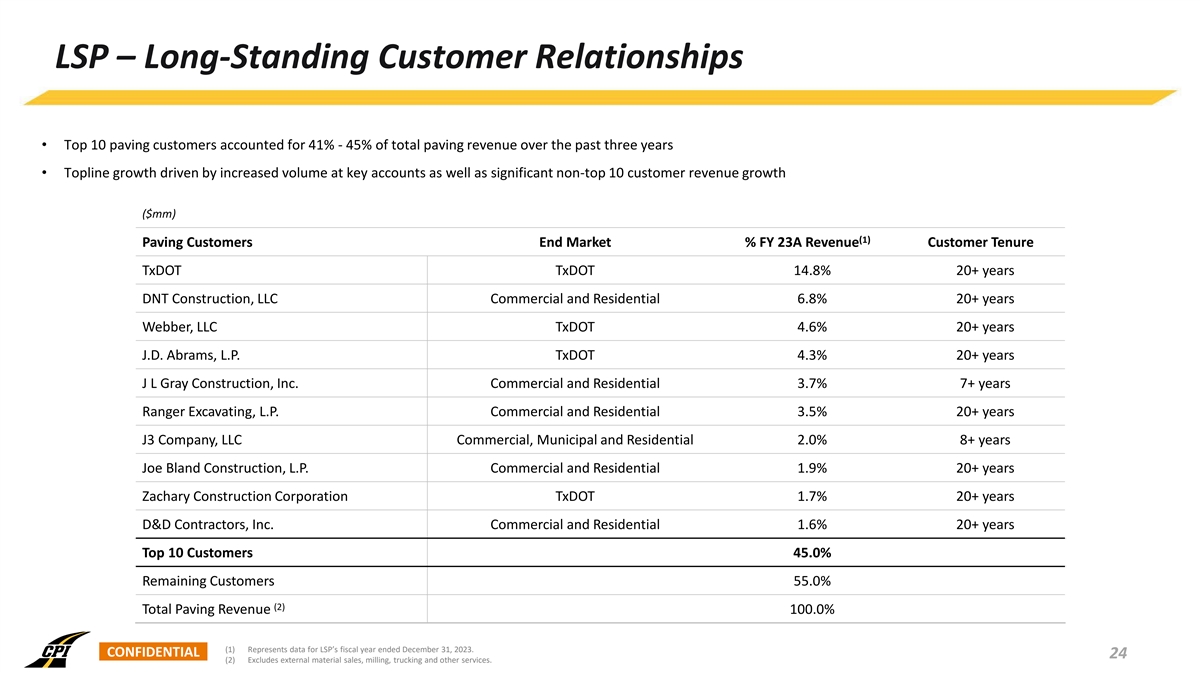
LSP – Long-Standing Customer Relationships • Top 10 paving customers accounted for 41% - 45% of total paving revenue over the past three years • Topline growth driven by increased volume at key accounts as well as significant non-top 10 customer revenue growth ($mm) (1) Paving Customers End Market % FY 23A Revenue Customer Tenure TxDOT TxDOT 14.8% 20+ years DNT Construction, LLC Commercial and Residential 6.8% 20+ years Webber, LLC TxDOT 4.6% 20+ years J.D. Abrams, L.P. TxDOT 4.3% 20+ years J L Gray Construction, Inc. Commercial and Residential 3.7% 7+ years Ranger Excavating, L.P. Commercial and Residential 3.5% 20+ years J3 Company, LLC Commercial, Municipal and Residential 2.0% 8+ years Joe Bland Construction, L.P. Commercial and Residential 1.9% 20+ years Zachary Construction Corporation TxDOT 1.7% 20+ years D&D Contractors, Inc. Commercial and Residential 1.6% 20+ years Top 10 Customers 45.0% Remaining Customers 55.0% (2) Total Paving Revenue 100.0% (1) Represents data for LSP’s fiscal year ended December 31, 2023. CONFIDENTIAL 24 (2) Excludes external material sales, milling, trucking and other services.
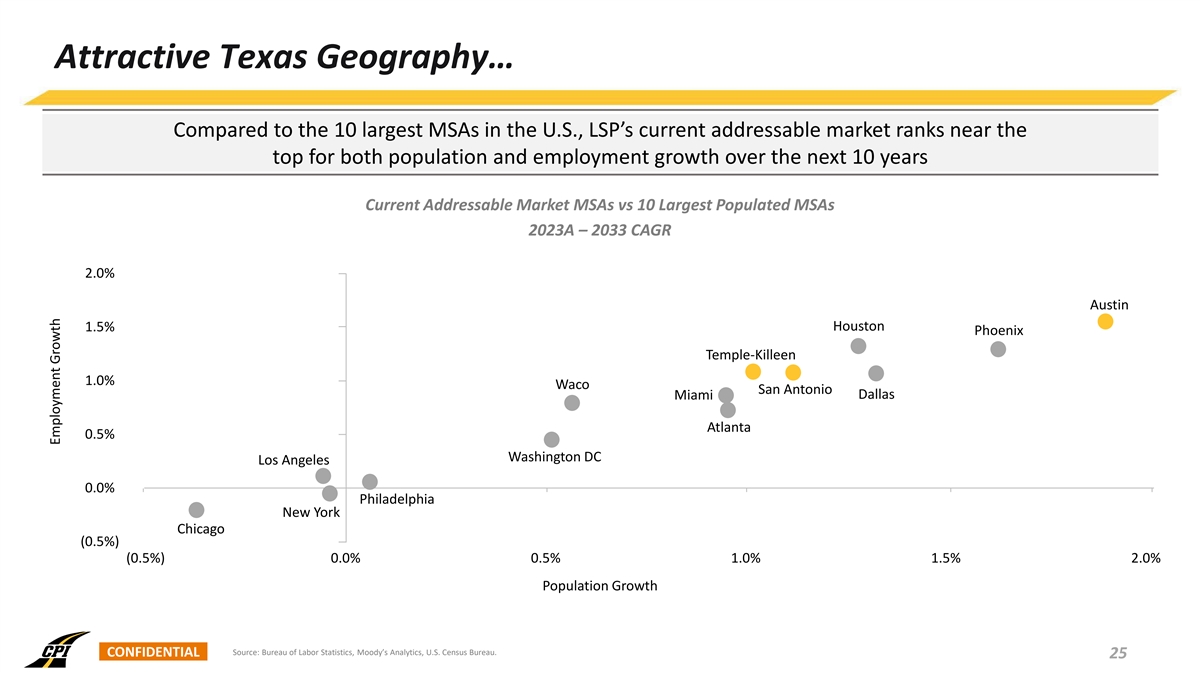
Attractive Texas Geography… Compared to the 10 largest MSAs in the U.S., LSP’s current addressable market ranks near the top for both population and employment growth over the next 10 years Current Addressable Market MSAs vs 10 Largest Populated MSAs 2023A – 2033 CAGR 2.0% Austin 1.5% Houston Phoenix Temple-Killeen 1.0% Waco San Antonio Dallas Miami Atlanta 0.5% Washington DC Los Angeles 0.0% Philadelphia New York Chicago (0.5%) (0.5%) 0.0% 0.5% 1.0% 1.5% 2.0% Population Growth Source: Bureau of Labor Statistics, Moody’s Analytics, U.S. Census Bureau. CONFIDENTIAL 25 Employment Growth
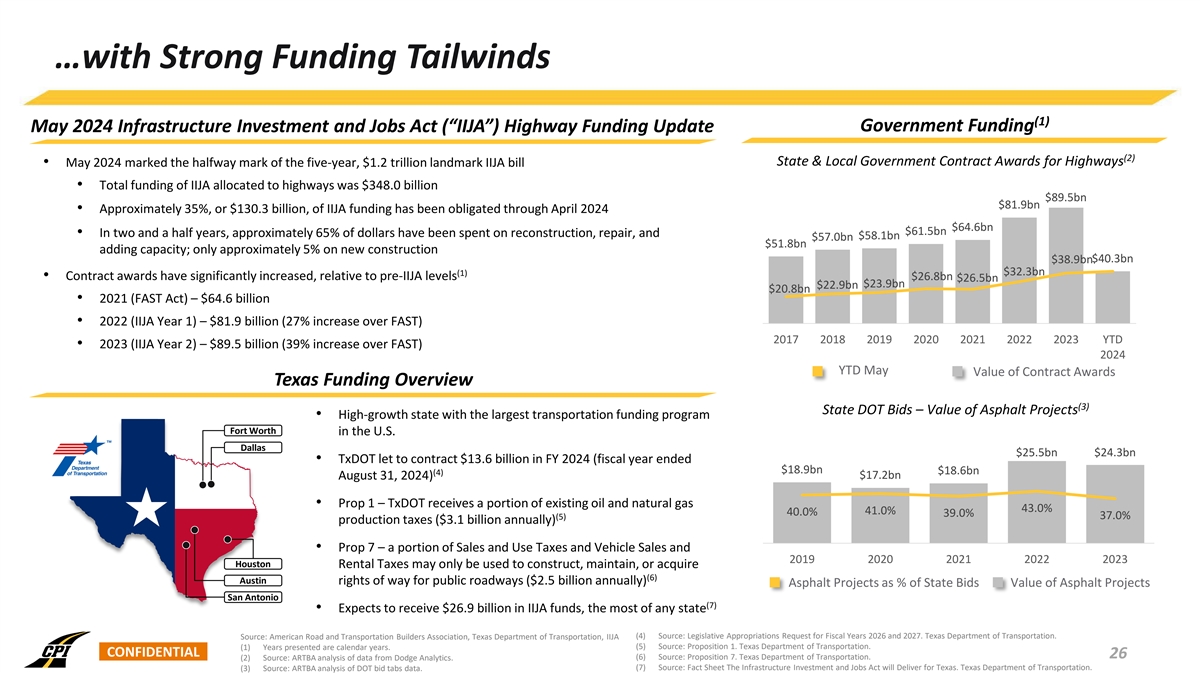
…with Strong Funding Tailwinds (1) Government Funding May 2024 Infrastructure Investment and Jobs Act (“IIJA”) Highway Funding Update (2) State & Local Government Contract Awards for Highways • May 2024 marked the halfway mark of the five-year, $1.2 trillion landmark IIJA bill • Total funding of IIJA allocated to highways was $348.0 billion $89.5bn $81.9bn • Approximately 35%, or $130.3 billion, of IIJA funding has been obligated through April 2024 $64.6bn $61.5bn • In two and a half years, approximately 65% of dollars have been spent on reconstruction, repair, and $58.1bn $57.0bn $51.8bn adding capacity; only approximately 5% on new construction $40.3bn $38.9bn $32.3bn (1) • Contract awards have significantly increased, relative to pre-IIJA levels $26.8bn $26.5bn $23.9bn $22.9bn $20.8bn • 2021 (FAST Act) – $64.6 billion • 2022 (IIJA Year 1) – $81.9 billion (27% increase over FAST) 2017 2018 2019 2020 2021 2022 2023 YTD • 2023 (IIJA Year 2) – $89.5 billion (39% increase over FAST) 2024 YTD May Value of Contract Awards Texas Funding Overview (3) State DOT Bids – Value of Asphalt Projects • High-growth state with the largest transportation funding program Fort Worth in the U.S. Dallas $25.5bn $24.3bn • TxDOT let to contract $13.6 billion in FY 2024 (fiscal year ended $18.9bn (4) $18.6bn $17.2bn August 31, 2024) • Prop 1 – TxDOT receives a portion of existing oil and natural gas 43.0% 41.0% 40.0% 39.0% (5) 37.0% production taxes ($3.1 billion annually) • Prop 7 – a portion of Sales and Use Taxes and Vehicle Sales and 2019 2020 2021 2022 2023 Houston Rental Taxes may only be used to construct, maintain, or acquire (6) Austin rights of way for public roadways ($2.5 billion annually) Asphalt Projects as % of State Bids Value of Asphalt Projects San Antonio (7) • Expects to receive $26.9 billion in IIJA funds, the most of any state (4) Source: Legislative Appropriations Request for Fiscal Years 2026 and 2027. Texas Department of Transportation. Source: American Road and Transportation Builders Association, Texas Department of Transportation, IIJA (5) Source: Proposition 1. Texas Department of Transportation. (1) Years presented are calendar years. CONFIDENTIAL 26 (6) Source: Proposition 7. Texas Department of Transportation. (2) Source: ARTBA analysis of data from Dodge Analytics. (7) Source: Fact Sheet The Infrastructure Investment and Jobs Act will Deliver for Texas. Texas Department of Transportation. (3) Source: ARTBA analysis of DOT bid tabs data.
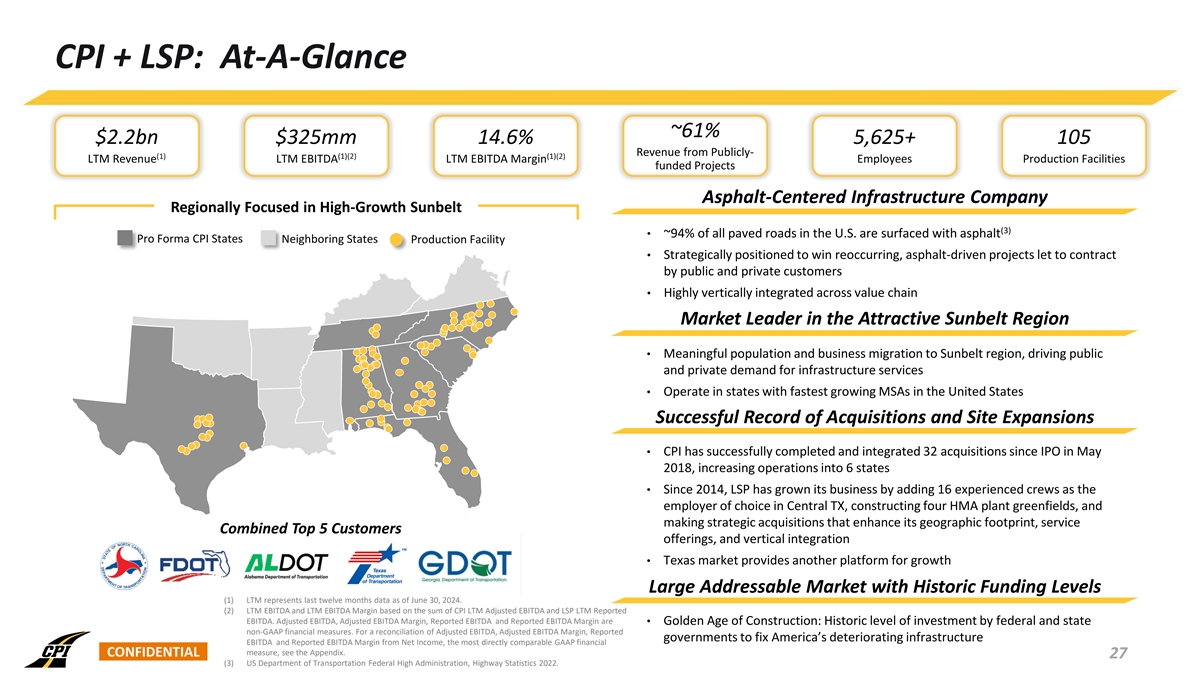
CPI + LSP: At-A-Glance ~61% $2.2bn $325mm 14.6% 5,625+ 105 Revenue from Publicly- (1) (1)(2) (1)(2) LTM Revenue LTM EBITDA LTM EBITDA Margin Employees Production Facilities funded Projects Asphalt-Centered Infrastructure Company Regionally Focused in High-Growth Sunbelt (3) • ~94% of all paved roads in the U.S. are surfaced with asphalt Pro Forma CPI States Neighboring States Production Facility • Strategically positioned to win reoccurring, asphalt-driven projects let to contract by public and private customers • Highly vertically integrated across value chain Market Leader in the Attractive Sunbelt Region • Meaningful population and business migration to Sunbelt region, driving public and private demand for infrastructure services • Operate in states with fastest growing MSAs in the United States Successful Record of Acquisitions and Site Expansions • CPI has successfully completed and integrated 32 acquisitions since IPO in May 2018, increasing operations into 6 states • Since 2014, LSP has grown its business by adding 16 experienced crews as the employer of choice in Central TX, constructing four HMA plant greenfields, and making strategic acquisitions that enhance its geographic footprint, service Combined Top 5 Customers offerings, and vertical integration • Texas market provides another platform for growth Large Addressable Market with Historic Funding Levels (1) LTM represents last twelve months data as of June 30, 2024. (2) LTM EBITDA and LTM EBITDA Margin based on the sum of CPI LTM Adjusted EBITDA and LSP LTM Reported EBITDA. Adjusted EBITDA, Adjusted EBITDA Margin, Reported EBITDA and Reported EBITDA Margin are • Golden Age of Construction: Historic level of investment by federal and state non-GAAP financial measures. For a reconciliation of Adjusted EBITDA, Adjusted EBITDA Margin, Reported governments to fix America’s deteriorating infrastructure EBITDA and Reported EBITDA Margin from Net Income, the most directly comparable GAAP financial CONFIDENTIAL measure, see the Appendix. 27 (3) US Department of Transportation Federal High Administration, Highway Statistics 2022.

Key Credit Highlights CONFIDENTIAL
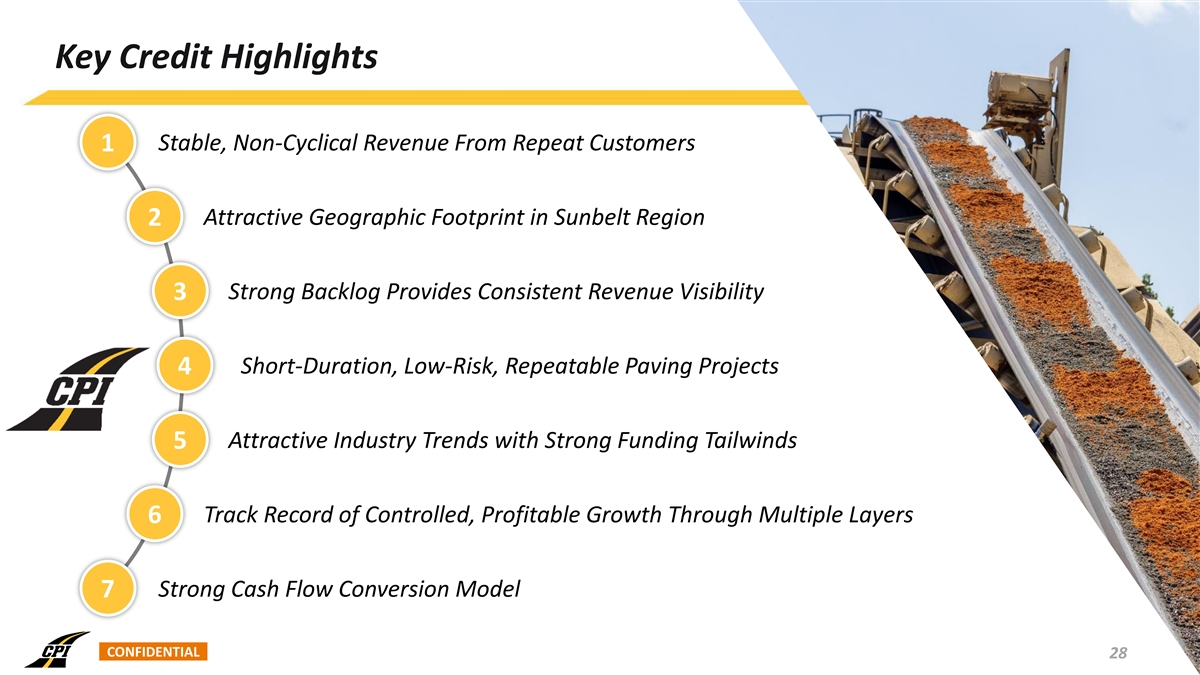
Key Credit Highlights 1 Stable, Non-Cyclical Revenue From Repeat Customers Attractive Geographic Footprint in Sunbelt Region 2 3 Strong Backlog Provides Consistent Revenue Visibility Short-Duration, Low-Risk, Repeatable Paving Projects 4 5 Attractive Industry Trends with Strong Funding Tailwinds Track Record of Controlled, Profitable Growth Through Multiple Layers 6 7 Strong Cash Flow Conversion Model CONFIDENTIAL 28
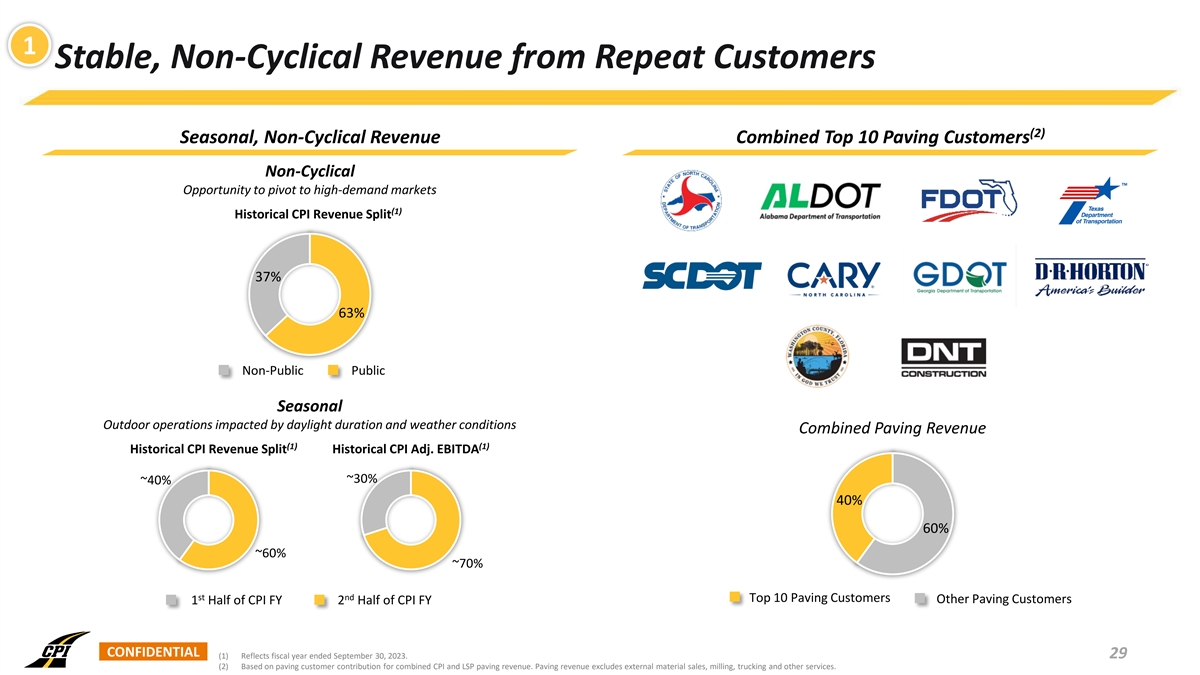
1 Stable, Non-Cyclical Revenue from Repeat Customers (2) Seasonal, Non-Cyclical Revenue Combined Top 10 Paving Customers Non-Cyclical Opportunity to pivot to high-demand markets (1) Historical CPI Revenue Split 37% 63% Non-Public Public Seasonal Outdoor operations impacted by daylight duration and weather conditions Combined Paving Revenue (1) (1) Historical CPI Revenue Split Historical CPI Adj. EBITDA ~30% ~40% 40% 60% ~60% ~70% st nd Top 10 Paving Customers Other Paving Customers 1 Half of CPI FY 2 Half of CPI FY CONFIDENTIAL (1) Reflects fiscal year ended September 30, 2023. 29 (2) Based on paving customer contribution for combined CPI and LSP paving revenue. Paving revenue excludes external material sales, milling, trucking and other services.
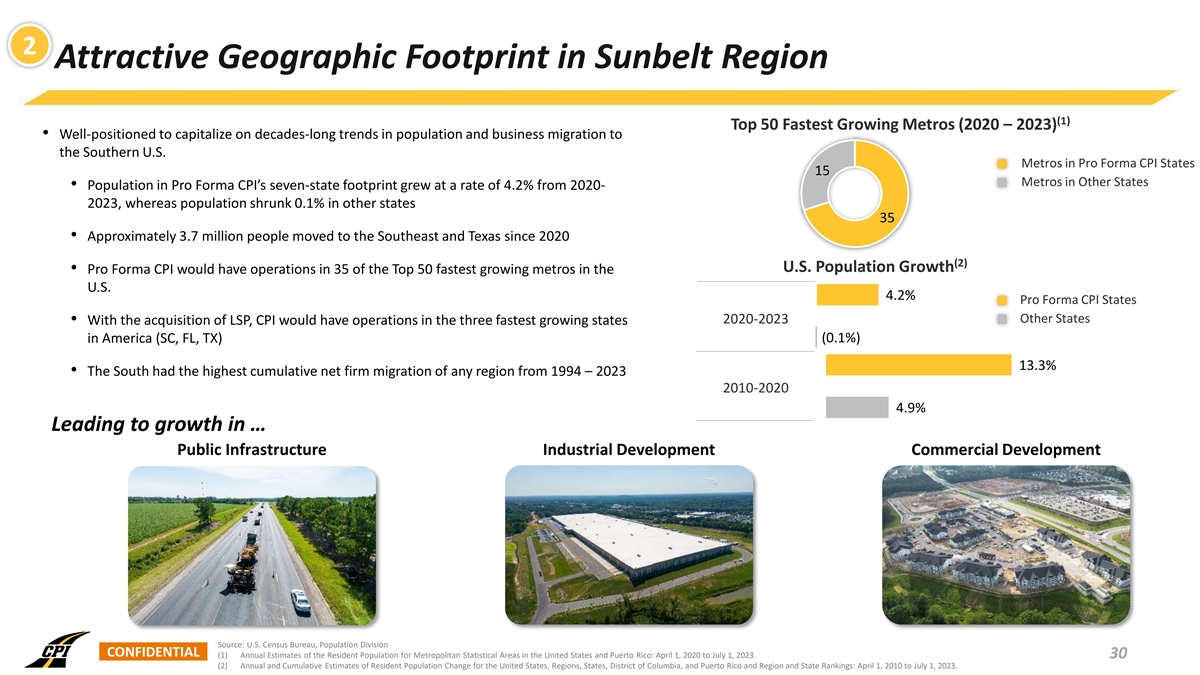
2 Attractive Geographic Footprint in Sunbelt Region (1) Top 50 Fastest Growing Metros (2020 – 2023) • Well-positioned to capitalize on decades-long trends in population and business migration to the Southern U.S. Metros in Pro Forma CPI States 15 Metros in Other States • Population in Pro Forma CPI’s seven-state footprint grew at a rate of 4.2% from 2020- 2023, whereas population shrunk 0.1% in other states 35 • Approximately 3.7 million people moved to the Southeast and Texas since 2020 (2) U.S. Population Growth • Pro Forma CPI would have operations in 35 of the Top 50 fastest growing metros in the U.S. 4.2% Pro Forma CPI States Other States 2020-2023 • With the acquisition of LSP, CPI would have operations in the three fastest growing states in America (SC, FL, TX) (0.1%) 13.3% • The South had the highest cumulative net firm migration of any region from 1994 – 2023 2010-2020 4.9% Leading to growth in … Public Infrastructure Industrial Development Commercial Development Source: U.S. Census Bureau, Population Division CONFIDENTIAL (1) Annual Estimates of the Resident Population for Metropolitan Statistical Areas in the United States and Puerto Rico: April 1, 2020 to July 1, 2023. 30 (2) Annual and Cumulative Estimates of Resident Population Change for the United States, Regions, States, District of Columbia, and Puerto Rico and Region and State Rankings: April 1, 2010 to July 1, 2023.
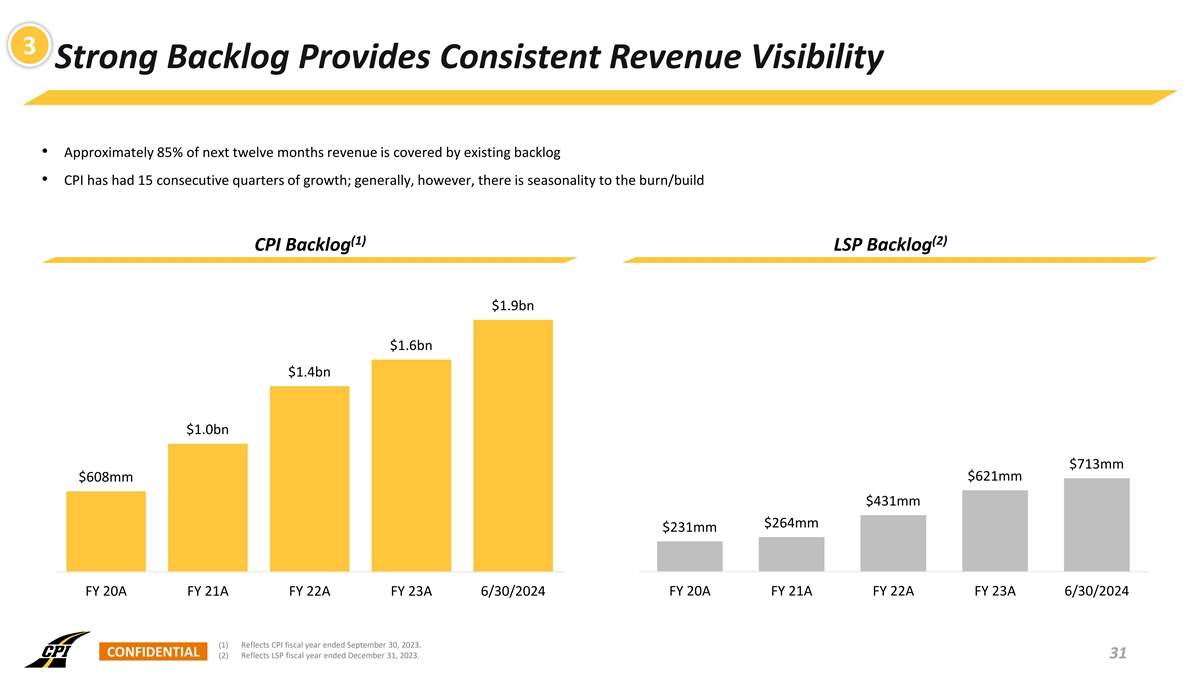
3 Strong Backlog Provides Consistent Revenue Visibility • Approximately 85% of next twelve months revenue is covered by existing backlog • CPI has had 15 consecutive quarters of growth; generally, however, there is seasonality to the burn/build (1) (2) CPI Backlog LSP Backlog $1.9bn $1.6bn $1.4bn $1.0bn $713mm $608mm $621mm $431mm $264mm $231mm FY 20A FY 21A FY 22A FY 23A 6/30/2024 FY 20A FY 21A FY 22A FY 23A 6/30/2024 (1) Reflects CPI fiscal year ended September 30, 2023. CONFIDENTIAL (2) Reflects LSP fiscal year ended December 31, 2023. 31
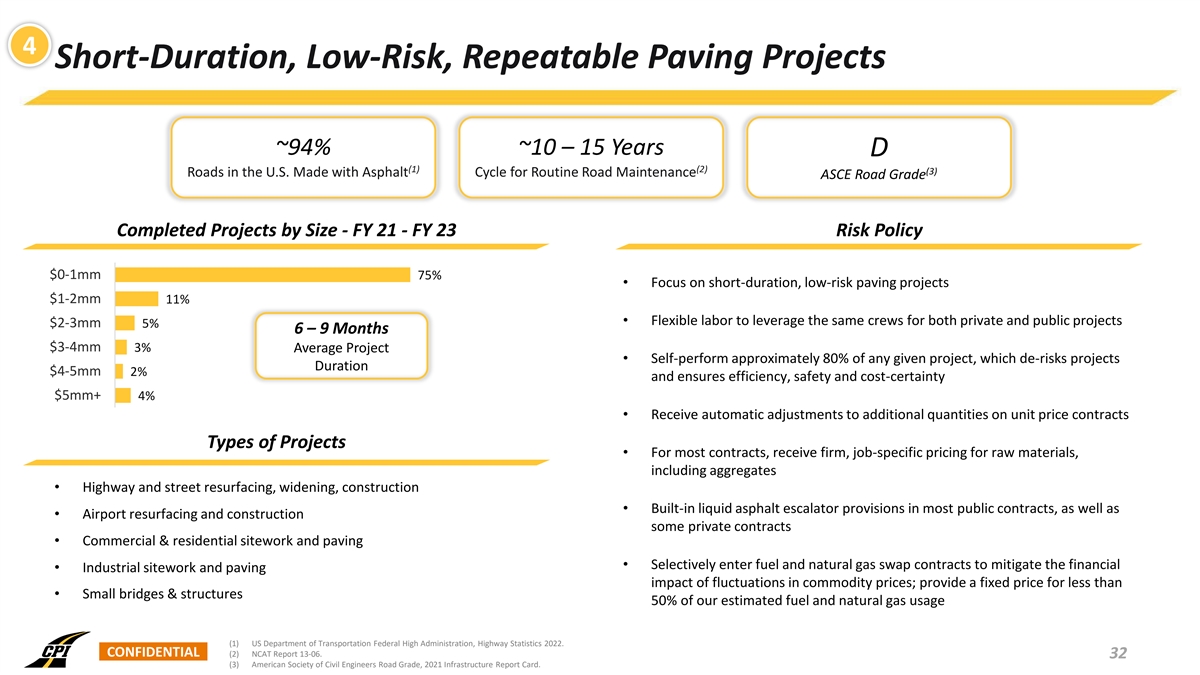
4 Short-Duration, Low-Risk, Repeatable Paving Projects ~94% ~10 – 15 Years D (1) (2) (3) Roads in the U.S. Made with Asphalt Cycle for Routine Road Maintenance ASCE Road Grade Completed Projects by Size - FY 21 - FY 23 Risk Policy $0-1mm 75% • Focus on short-duration, low-risk paving projects $1-2mm 11% • Flexible labor to leverage the same crews for both private and public projects $2-3mm 5% 6 – 9 Months $3-4mm 3% Average Project • Self-perform approximately 80% of any given project, which de-risks projects Duration $4-5mm 2% and ensures efficiency, safety and cost-certainty $5mm+ 4% • Receive automatic adjustments to additional quantities on unit price contracts Types of Projects • For most contracts, receive firm, job-specific pricing for raw materials, including aggregates • Highway and street resurfacing, widening, construction • Built-in liquid asphalt escalator provisions in most public contracts, as well as • Airport resurfacing and construction some private contracts • Commercial & residential sitework and paving • Selectively enter fuel and natural gas swap contracts to mitigate the financial • Industrial sitework and paving impact of fluctuations in commodity prices; provide a fixed price for less than • Small bridges & structures 50% of our estimated fuel and natural gas usage (1) US Department of Transportation Federal High Administration, Highway Statistics 2022. CONFIDENTIAL (2) NCAT Report 13-06. 32 (3) American Society of Civil Engineers Road Grade, 2021 Infrastructure Report Card.
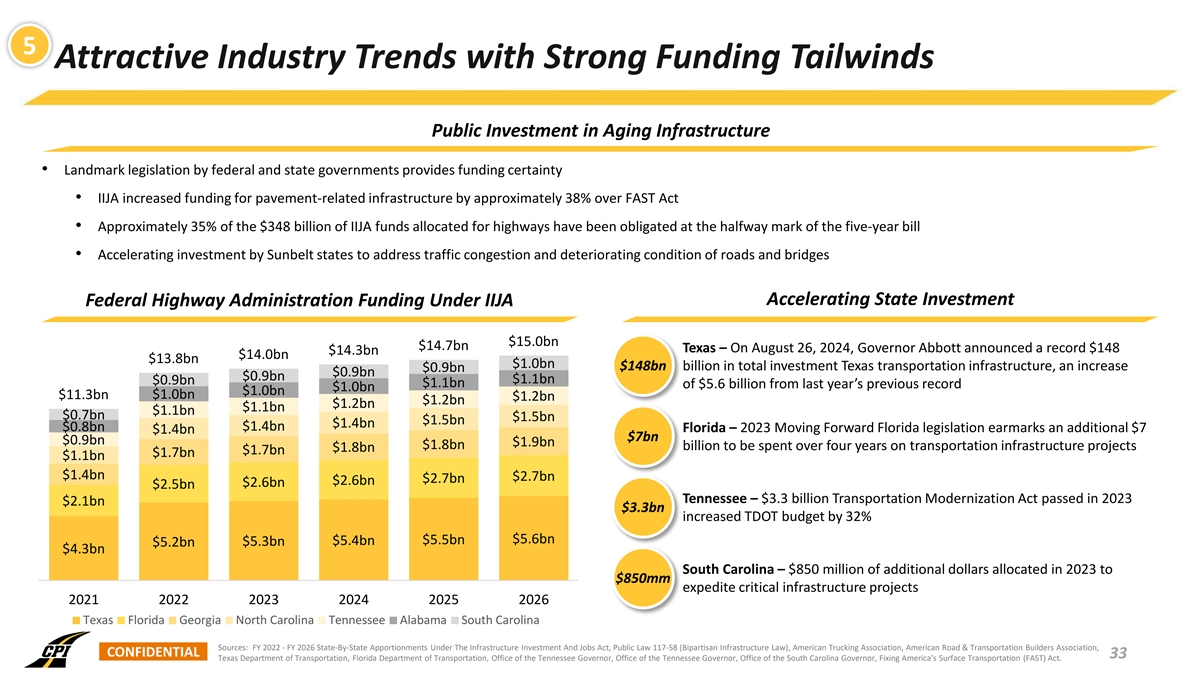
5 Attractive Industry Trends with Strong Funding Tailwinds Public Investment in Aging Infrastructure • Landmark legislation by federal and state governments provides funding certainty • IIJA increased funding for pavement-related infrastructure by approximately 38% over FAST Act • Approximately 35% of the $348 billion of IIJA funds allocated for highways have been obligated at the halfway mark of the five-year bill • Accelerating investment by Sunbelt states to address traffic congestion and deteriorating condition of roads and bridges Accelerating State Investment Federal Highway Administration Funding Under IIJA $15.0bn $14.7bn Texas – On August 26, 2024, Governor Abbott announced a record $148 $14.3bn $14.0bn $13.8bn $1.0bn $148bn billion in total investment Texas transportation infrastructure, an increase $0.9bn $0.9bn $0.9bn $1.1bn $0.9bn $1.1bn of $5.6 billion from last year’s previous record $1.0bn $1.0bn $11.3bn $1.0bn $1.2bn $1.2bn $1.2bn $1.1bn $1.1bn $0.7bn $1.5bn $1.5bn $1.4bn $0.8bn $1.4bn Florida – 2023 Moving Forward Florida legislation earmarks an additional $7 $1.4bn $7bn $0.9bn $1.9bn $1.8bn billion to be spent over four years on transportation infrastructure projects $1.8bn $1.7bn $1.7bn $1.1bn $1.4bn $2.7bn $2.7bn $2.6bn $2.6bn $2.5bn Tennessee – $3.3 billion Transportation Modernization Act passed in 2023 $2.1bn $3.3bn increased TDOT budget by 32% $5.6bn $5.4bn $5.5bn $5.2bn $5.3bn $4.3bn South Carolina – $850 million of additional dollars allocated in 2023 to $850mm expedite critical infrastructure projects 2021 2022 2023 2024 2025 2026 Texas Florida Georgia North Carolina Tennessee Alabama South Carolina Sources: FY 2022 - FY 2026 State-By-State Apportionments Under The Infrastructure Investment And Jobs Act, Public Law 117-58 (Bipartisan Infrastructure Law), American Trucking Association, American Road & Transportation Builders Association, CONFIDENTIAL 33 Texas Department of Transportation, Florida Department of Transportation, Office of the Tennessee Governor, Office of the Tennessee Governor, Office of the South Carolina Governor, Fixing America’s Surface Transportation (FAST) Act.
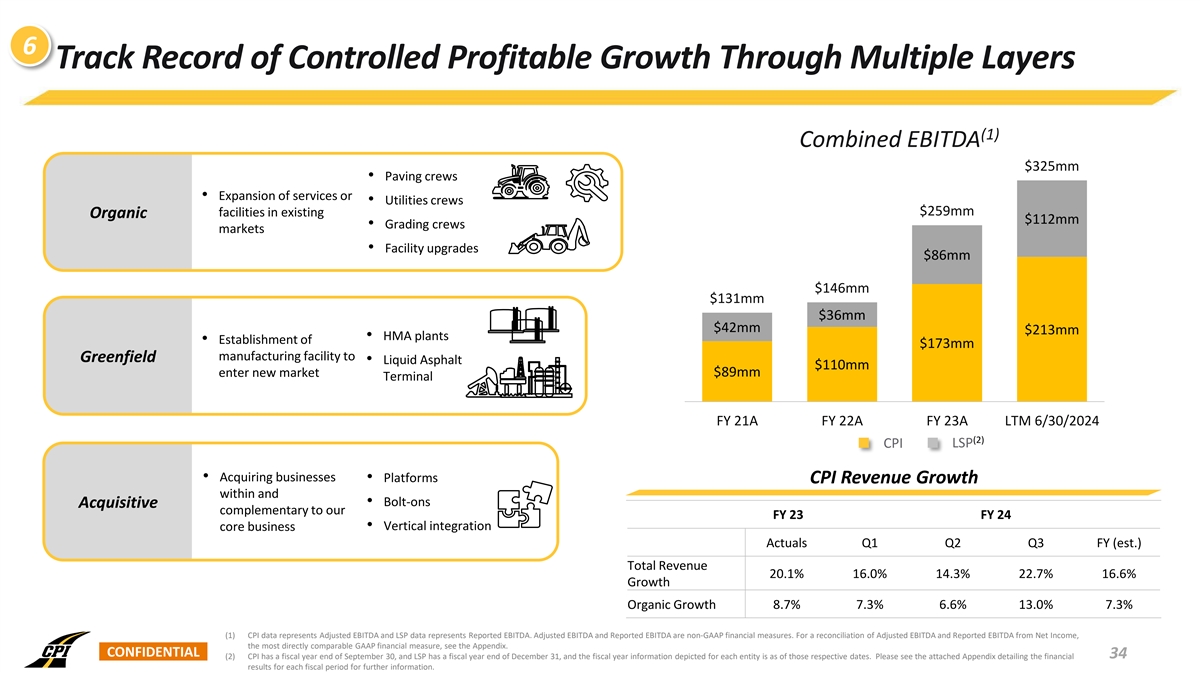
6 Track Record of Controlled Profitable Growth Through Multiple Layers (1) Combined EBITDA $325mm • Paving crews • Expansion of services or • Utilities crews facilities in existing $259mm Organic $112mm • Grading crews markets • Facility upgrades $86mm $146mm $131mm $36mm $42mm $213mm • HMA plants • Establishment of $173mm manufacturing facility to Greenfield • Liquid Asphalt $110mm $89mm enter new market Terminal FY 21A FY 22A FY 23A LTM 6/30/2024 (2) CPI LSP • Acquiring businesses • Platforms CPI Revenue Growth within and • Bolt-ons Acquisitive complementary to our FY 23 FY 24 • Vertical integration core business Actuals Q1 Q2 Q3 FY (est.) Total Revenue 20.1% 16.0% 14.3% 22.7% 16.6% Growth Organic Growth 8.7% 7.3% 6.6% 13.0% 7.3% (1) CPI data represents Adjusted EBITDA and LSP data represents Reported EBITDA. Adjusted EBITDA and Reported EBITDA are non-GAAP financial measures. For a reconciliation of Adjusted EBITDA and Reported EBITDA from Net Income, the most directly comparable GAAP financial measure, see the Appendix. CONFIDENTIAL 34 (2) CPI has a fiscal year end of September 30, and LSP has a fiscal year end of December 31, and the fiscal year information depicted for each entity is as of those respective dates. Please see the attached Appendix detailing the financial results for each fiscal period for further information.
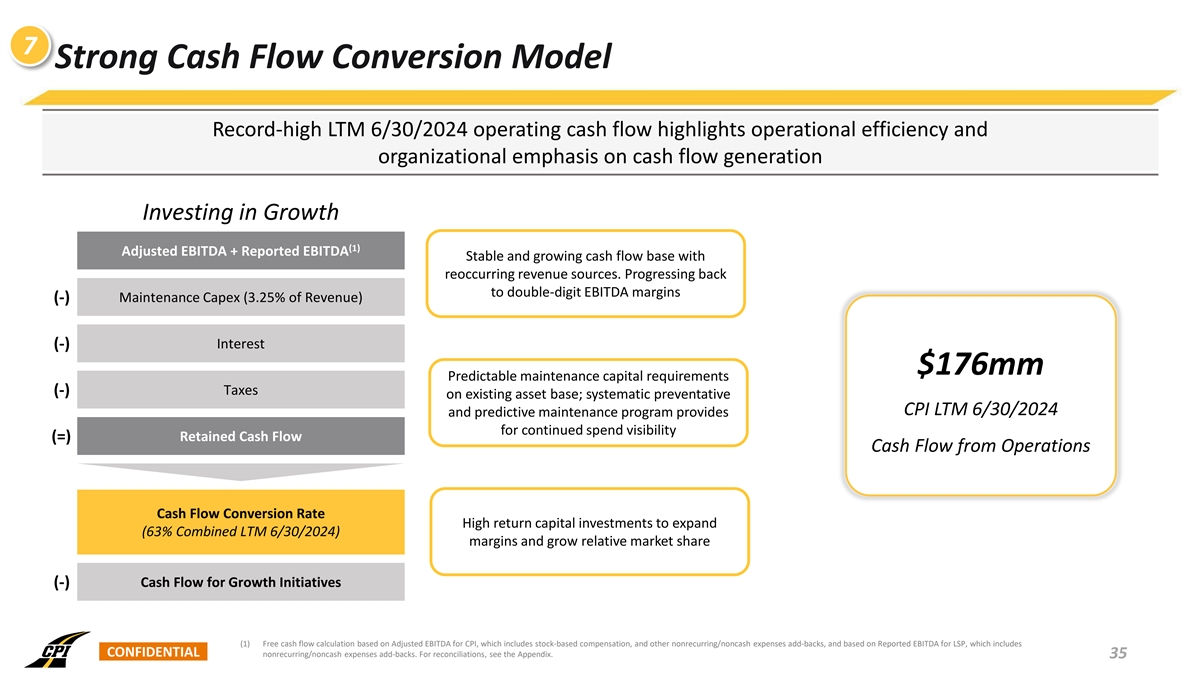
7 Strong Cash Flow Conversion Model Record-high LTM 6/30/2024 operating cash flow highlights operational efficiency and organizational emphasis on cash flow generation Investing in Growth (1) Adjusted EBITDA + Reported EBITDA Stable and growing cash flow base with reoccurring revenue sources. Progressing back to double-digit EBITDA margins (-) Maintenance Capex (3.25% of Revenue) (-) Interest $176mm Predictable maintenance capital requirements (-) Taxes on existing asset base; systematic preventative CPI LTM 6/30/2024 and predictive maintenance program provides for continued spend visibility Retained Cash Flow (=) Cash Flow from Operations Cash Flow Conversion Rate High return capital investments to expand (63% Combined LTM 6/30/2024) margins and grow relative market share (-) Cash Flow for Growth Initiatives (1) Free cash flow calculation based on Adjusted EBITDA for CPI, which includes stock-based compensation, and other nonrecurring/noncash expenses add-backs, and based on Reported EBITDA for LSP, which includes CONFIDENTIAL nonrecurring/noncash expenses add-backs. For reconciliations, see the Appendix. 35
Financial Overview CONFIDENTIAL
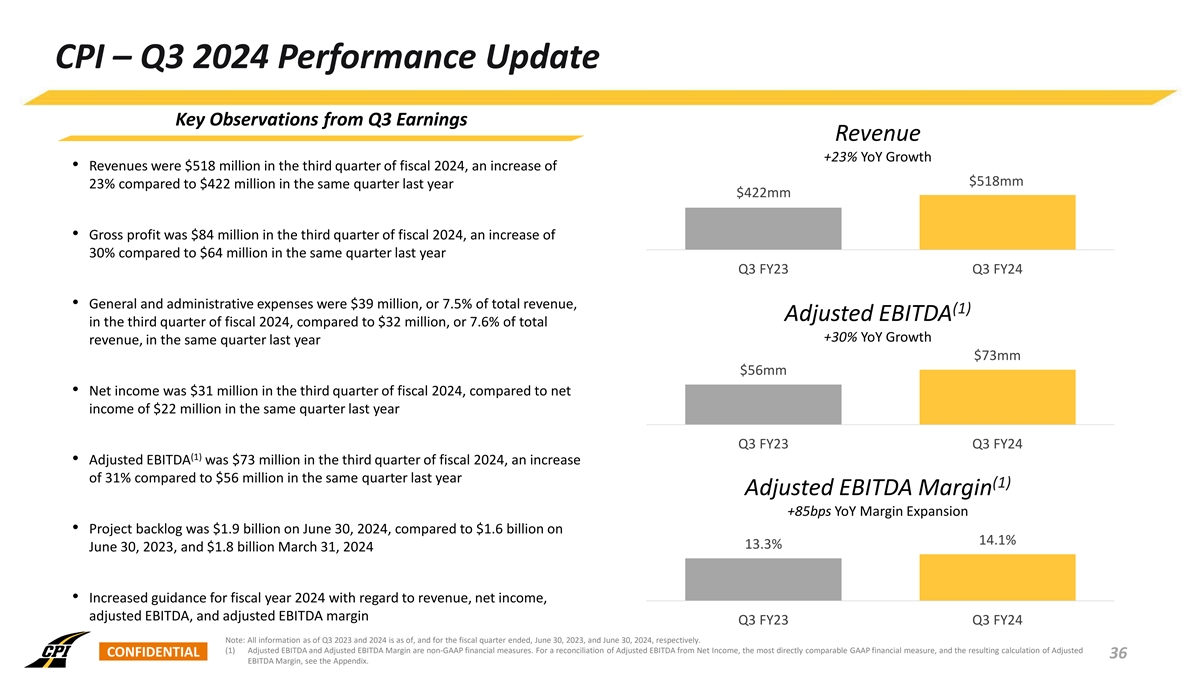
CPI – Q3 2024 Performance Update Key Observations from Q3 Earnings Revenue +23% YoY Growth • Revenues were $518 million in the third quarter of fiscal 2024, an increase of $518mm 23% compared to $422 million in the same quarter last year $422mm • Gross profit was $84 million in the third quarter of fiscal 2024, an increase of 30% compared to $64 million in the same quarter last year Q3 FY23 Q3 FY24 • General and administrative expenses were $39 million, or 7.5% of total revenue, (1) Adjusted EBITDA in the third quarter of fiscal 2024, compared to $32 million, or 7.6% of total +30% YoY Growth revenue, in the same quarter last year $73mm $56mm • Net income was $31 million in the third quarter of fiscal 2024, compared to net income of $22 million in the same quarter last year Q3 FY23 Q3 FY24 (1) • Adjusted EBITDA was $73 million in the third quarter of fiscal 2024, an increase of 31% compared to $56 million in the same quarter last year (1) Adjusted EBITDA Margin +85bps YoY Margin Expansion • Project backlog was $1.9 billion on June 30, 2024, compared to $1.6 billion on 14.1% 13.3% June 30, 2023, and $1.8 billion March 31, 2024 • Increased guidance for fiscal year 2024 with regard to revenue, net income, adjusted EBITDA, and adjusted EBITDA margin Q3 FY23 Q3 FY24 Note: All information as of Q3 2023 and 2024 is as of, and for the fiscal quarter ended, June 30, 2023, and June 30, 2024, respectively. (1) Adjusted EBITDA and Adjusted EBITDA Margin are non-GAAP financial measures. For a reconciliation of Adjusted EBITDA from Net Income, the most directly comparable GAAP financial measure, and the resulting calculation of Adjusted CONFIDENTIAL 36 EBITDA Margin, see the Appendix.
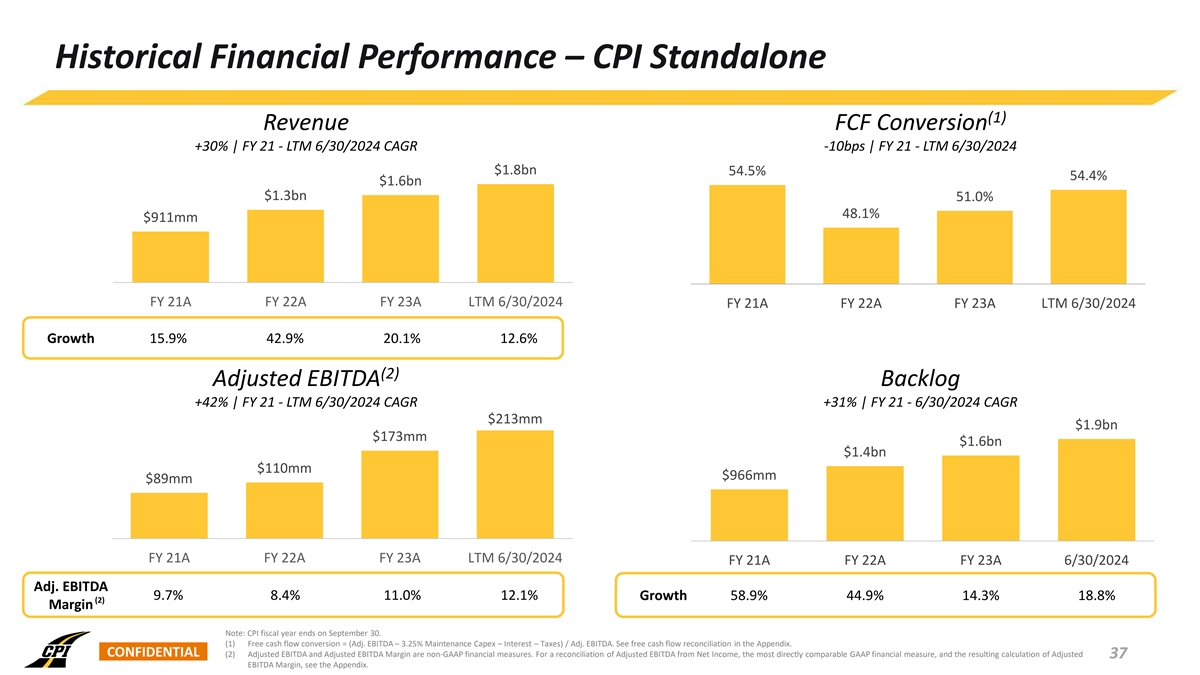
Historical Financial Performance – CPI Standalone (1) Revenue FCF Conversion +30% | FY 21 - LTM 6/30/2024 CAGR -10bps | FY 21 - LTM 6/30/2024 $1.8bn 54.5% 54.4% $1.6bn $1.3bn 51.0% 48.1% $911mm FY 21A FY 22A FY 23A LTM 6/30/2024 FY 21A FY 22A FY 23A LTM 6/30/2024 Growth 15.9% 42.9% 20.1% 12.6% (2) Adjusted EBITDA Backlog +42% | FY 21 - LTM 6/30/2024 CAGR +31% | FY 21 - 6/30/2024 CAGR $213mm $1.9bn $173mm $1.6bn $1.4bn $110mm $966mm $89mm FY 21A FY 22A FY 23A LTM 6/30/2024 FY 21A FY 22A FY 23A 6/30/2024 Adj. EBITDA 9.7% 8.4% 11.0% 12.1% Growth 58.9% 44.9% 14.3% 18.8% (2) Margin Note: CPI fiscal year ends on September 30. (1) Free cash flow conversion = (Adj. EBITDA – 3.25% Maintenance Capex – Interest – Taxes) / Adj. EBITDA. See free cash flow reconciliation in the Appendix. CONFIDENTIAL (2) Adjusted EBITDA and Adjusted EBITDA Margin are non-GAAP financial measures. For a reconciliation of Adjusted EBITDA from Net Income, the most directly comparable GAAP financial measure, and the resulting calculation of Adjusted 37 EBITDA Margin, see the Appendix.
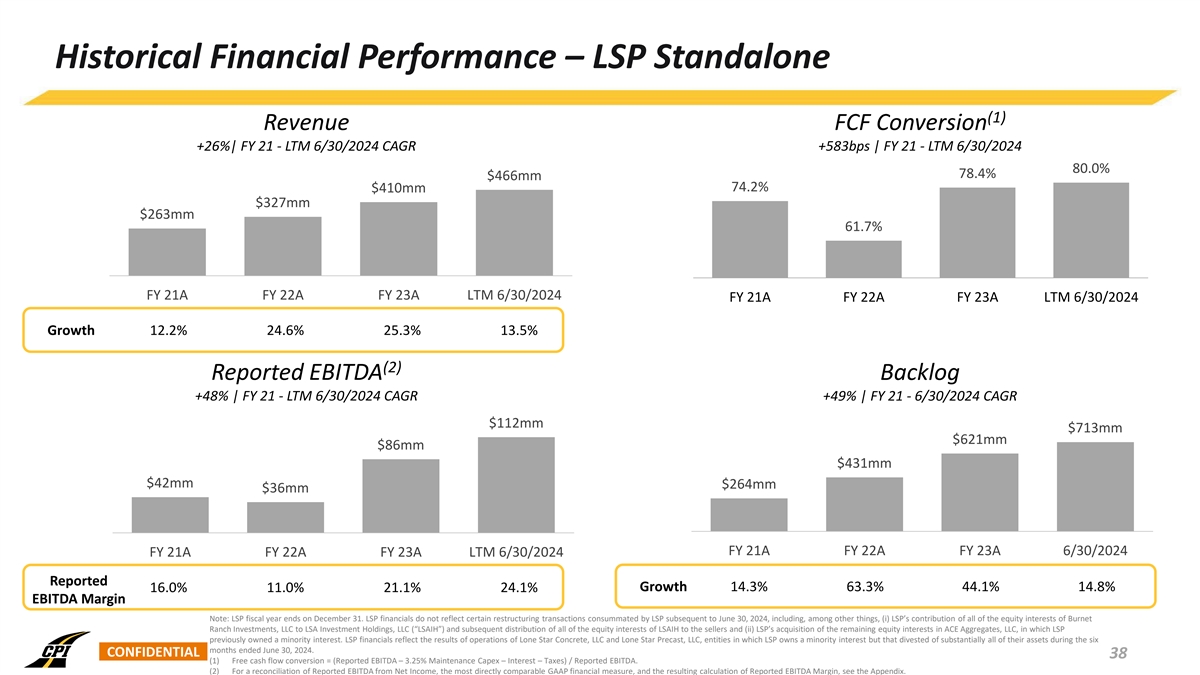
Historical Financial Performance – LSP Standalone (1) Revenue FCF Conversion +26%| FY 21 - LTM 6/30/2024 CAGR +583bps | FY 21 - LTM 6/30/2024 80.0% 78.4% $466mm 74.2% $410mm $327mm $263mm 61.7% FY 21A FY 22A FY 23A LTM 6/30/2024 FY 21A FY 22A FY 23A LTM 6/30/2024 Growth 12.2% 24.6% 25.3% 13.5% (2) Reported EBITDA Backlog +48% | FY 21 - LTM 6/30/2024 CAGR +49% | FY 21 - 6/30/2024 CAGR $112mm $713mm $621mm $86mm $431mm $42mm $264mm $36mm FY 21A FY 22A FY 23A 6/30/2024 FY 21A FY 22A FY 23A LTM 6/30/2024 Reported Growth 14.3% 63.3% 44.1% 14.8% 16.0% 11.0% 21.1% 24.1% EBITDA Margin Note: LSP fiscal year ends on December 31. LSP financials do not reflect certain restructuring transactions consummated by LSP subsequent to June 30, 2024, including, among other things, (i) LSP’s contribution of all of the equity interests of Burnet Ranch Investments, LLC to LSA Investment Holdings, LLC (“LSAIH”) and subsequent distribution of all of the equity interests of LSAIH to the sellers and (ii) LSP’s acquisition of the remaining equity interests in ACE Aggregates, LLC, in which LSP previously owned a minority interest. LSP financials reflect the results of operations of Lone Star Concrete, LLC and Lone Star Precast, LLC, entities in which LSP owns a minority interest but that divested of substantially all of their assets during the six months ended June 30, 2024. CONFIDENTIAL 38 (1) Free cash flow conversion = (Reported EBITDA – 3.25% Maintenance Capex – Interest – Taxes) / Reported EBITDA. (2) For a reconciliation of Reported EBITDA from Net Income, the most directly comparable GAAP financial measure, and the resulting calculation of Reported EBITDA Margin, see the Appendix.
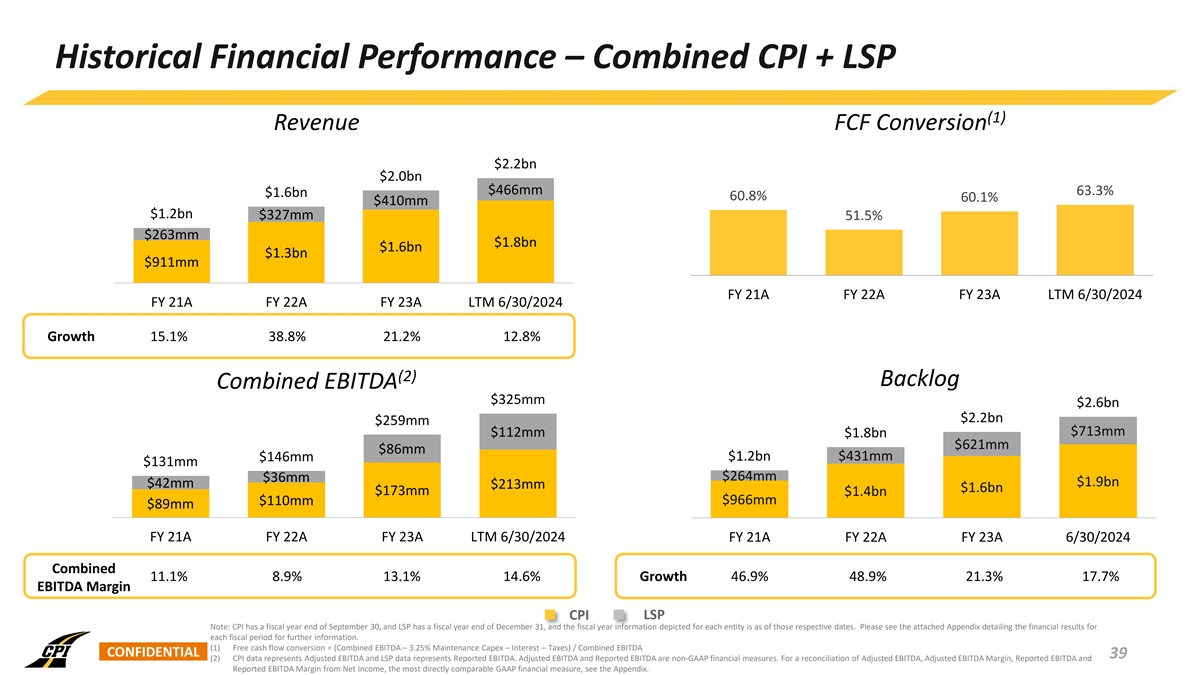
Historical Financial Performance – Combined CPI + LSP (1) Revenue FCF Conversion $2.2bn $2.0bn $466mm 63.3% $1.6bn 60.8% 60.1% $410mm $1.2bn $327mm 51.5% $263mm $1.8bn $1.6bn $1.3bn $911mm FY 21A FY 22A FY 23A LTM 6/30/2024 FY 21A FY 22A FY 23A LTM 6/30/2024 Growth 15.1% 38.8% 21.2% 12.8% (2) Backlog Combined EBITDA $325mm $2.6bn $2.2bn $259mm $713mm $112mm $1.8bn $621mm $86mm $146mm $1.2bn $431mm $131mm $264mm $36mm $1.9bn $42mm $213mm $1.6bn $173mm $1.4bn $110mm $966mm $89mm FY 21A FY 22A FY 23A LTM 6/30/2024 FY 21A FY 22A FY 23A 6/30/2024 Combined 11.1% 8.9% 13.1% 14.6% Growth 46.9% 48.9% 21.3% 17.7% EBITDA Margin CPI LSP Note: CPI has a fiscal year end of September 30, and LSP has a fiscal year end of December 31, and the fiscal year information depicted for each entity is as of those respective dates. Please see the attached Appendix detailing the financial results for each fiscal period for further information. (1) Free cash flow conversion = (Combined EBITDA – 3.25% Maintenance Capex – Interest – Taxes) / Combined EBITDA CONFIDENTIAL 39 (2) CPI data represents Adjusted EBITDA and LSP data represents Reported EBITDA. Adjusted EBITDA and Reported EBITDA are non-GAAP financial measures. For a reconciliation of Adjusted EBITDA, Adjusted EBITDA Margin, Reported EBITDA and Reported EBITDA Margin from Net Income, the most directly comparable GAAP financial measure, see the Appendix.
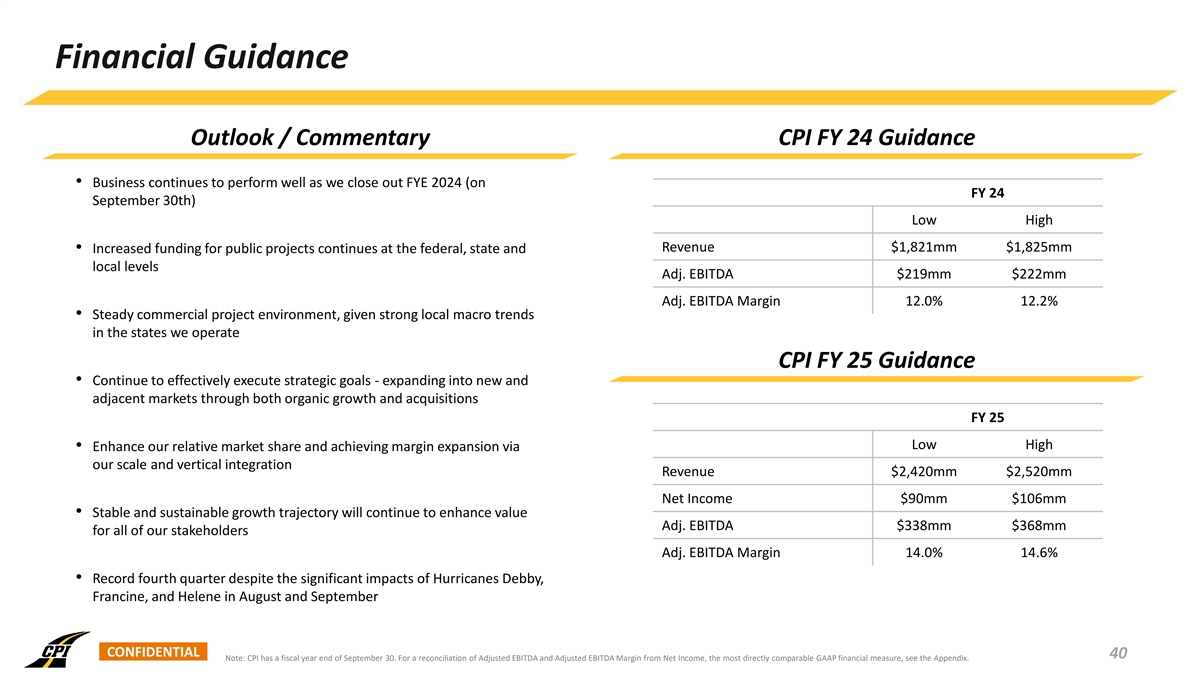
Financial Guidance Outlook / Commentary CPI FY 24 Guidance • Business continues to perform well as we close out FYE 2024 (on FY 24 September 30th) Low High Revenue $1,821mm $1,825mm • Increased funding for public projects continues at the federal, state and local levels Adj. EBITDA $219mm $222mm Adj. EBITDA Margin 12.0% 12.2% • Steady commercial project environment, given strong local macro trends in the states we operate CPI FY 25 Guidance • Continue to effectively execute strategic goals - expanding into new and adjacent markets through both organic growth and acquisitions FY 25 Low High • Enhance our relative market share and achieving margin expansion via our scale and vertical integration Revenue $2,420mm $2,520mm Net Income $90mm $106mm • Stable and sustainable growth trajectory will continue to enhance value Adj. EBITDA $338mm $368mm for all of our stakeholders Adj. EBITDA Margin 14.0% 14.6% • Record fourth quarter despite the significant impacts of Hurricanes Debby, Francine, and Helene in August and September CONFIDENTIAL 40 Note: CPI has a fiscal year end of September 30. For a reconciliation of Adjusted EBITDA and Adjusted EBITDA Margin from Net Income, the most directly comparable GAAP financial measure, see the Appendix.
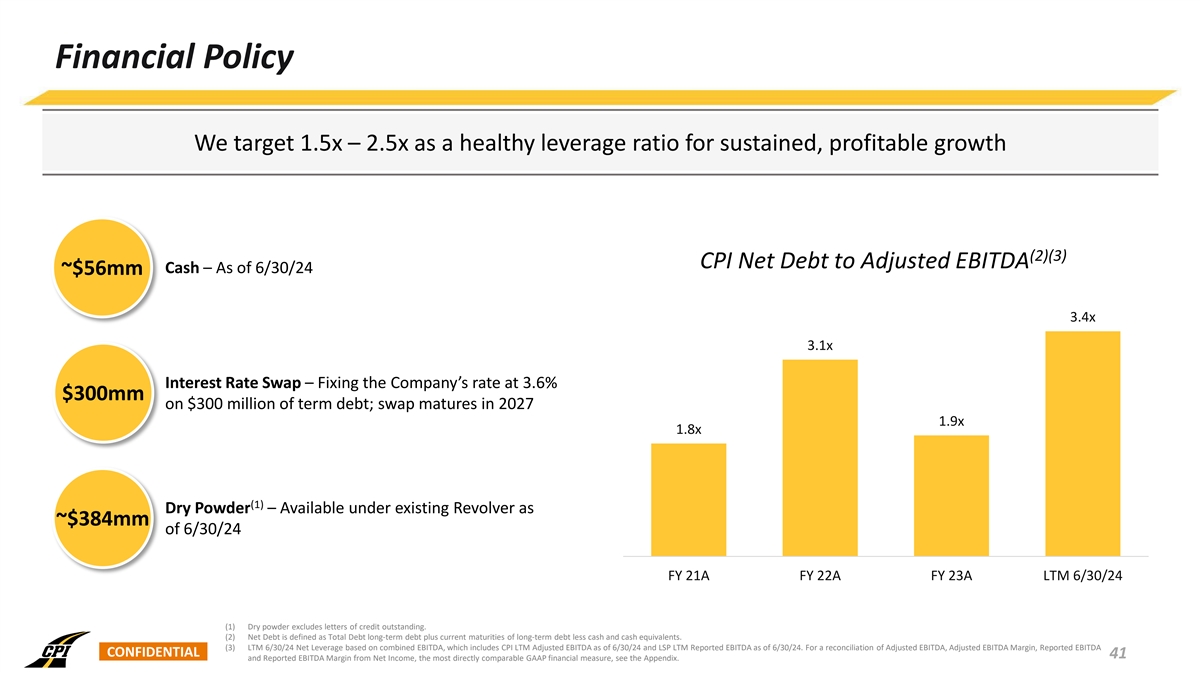
Financial Policy We target 1.5x – 2.5x as a healthy leverage ratio for sustained, profitable growth (2)(3) CPI Net Debt to Adjusted EBITDA Cash – As of 6/30/24 ~$56mm 3.4x 3.1x Interest Rate Swap – Fixing the Company’s rate at 3.6% $300mm on $300 million of term debt; swap matures in 2027 1.9x 1.8x (1) Dry Powder – Available under existing Revolver as ~$384mm of 6/30/24 FY 21A FY 22A FY 23A LTM 6/30/24 (1) Dry powder excludes letters of credit outstanding. (2) Net Debt is defined as Total Debt long-term debt plus current maturities of long-term debt less cash and cash equivalents. (3) LTM 6/30/24 Net Leverage based on combined EBITDA, which includes CPI LTM Adjusted EBITDA as of 6/30/24 and LSP LTM Reported EBITDA as of 6/30/24. For a reconciliation of Adjusted EBITDA, Adjusted EBITDA Margin, Reported EBITDA CONFIDENTIAL 41 and Reported EBITDA Margin from Net Income, the most directly comparable GAAP financial measure, see the Appendix.
Appendix CONFIDENTIAL
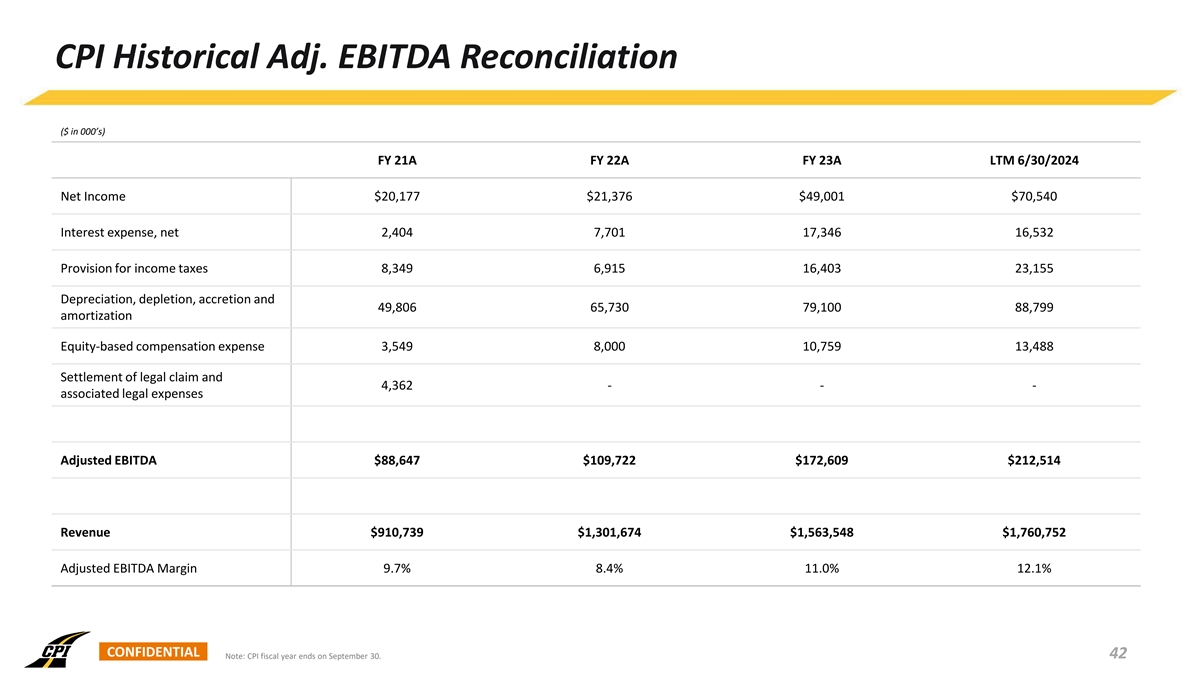
CPI Historical Adj. EBITDA Reconciliation ($ in 000’s) FY 21A FY 22A FY 23A LTM 6/30/2024 Net Income $20,177 $21,376 $49,001 $70,540 Interest expense, net 2,404 7,701 17,346 16,532 Provision for income taxes 8,349 6,915 16,403 23,155 Depreciation, depletion, accretion and 49,806 65,730 79,100 88,799 amortization Equity-based compensation expense 3,549 8,000 10,759 13,488 Settlement of legal claim and 4,362 - - - associated legal expenses Adjusted EBITDA $88,647 $109,722 $172,609 $212,514 Revenue $910,739 $1,301,674 $1,563,548 $1,760,752 Adjusted EBITDA Margin 9.7% 8.4% 11.0% 12.1% CONFIDENTIAL Note: CPI fiscal year ends on September 30. 42
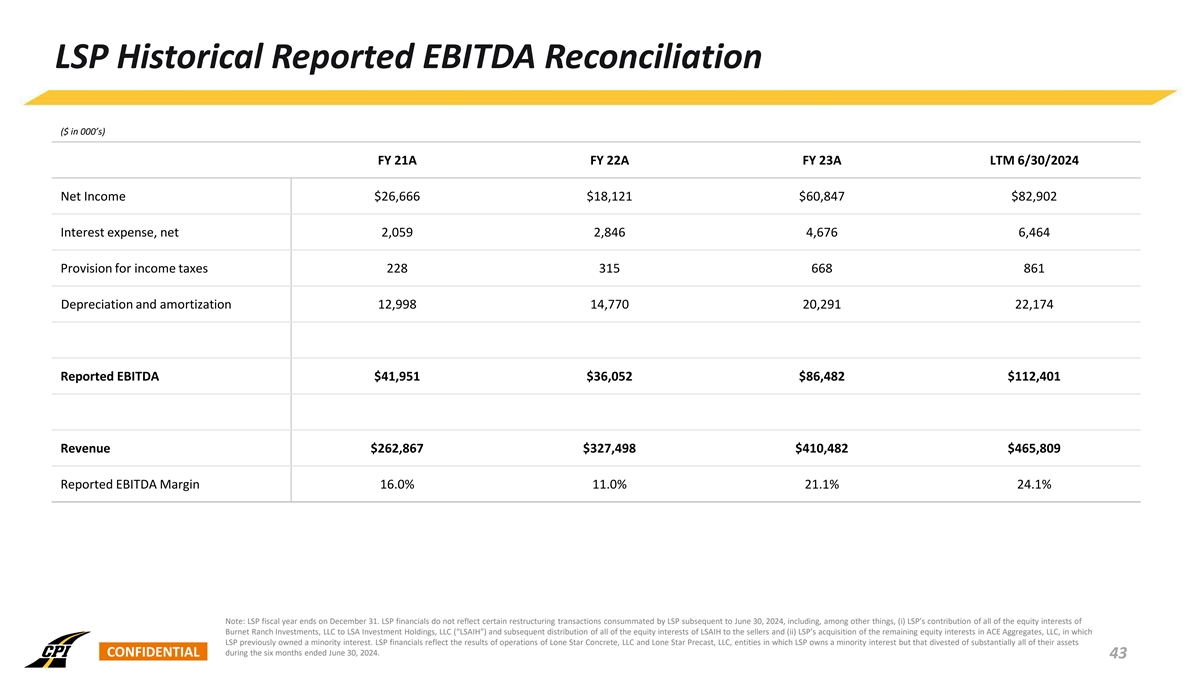
LSP Historical Reported EBITDA Reconciliation ($ in 000’s) FY 21A FY 22A FY 23A LTM 6/30/2024 Net Income $26,666 $18,121 $60,847 $82,902 Interest expense, net 2,059 2,846 4,676 6,464 Provision for income taxes 228 315 668 861 Depreciation and amortization 12,998 14,770 20,291 22,174 Reported EBITDA $41,951 $36,052 $86,482 $112,401 Revenue $262,867 $327,498 $410,482 $465,809 Reported EBITDA Margin 16.0% 11.0% 21.1% 24.1% Note: LSP fiscal year ends on December 31. LSP financials do not reflect certain restructuring transactions consummated by LSP subsequent to June 30, 2024, including, among other things, (i) LSP’s contribution of all of the equity interests of Burnet Ranch Investments, LLC to LSA Investment Holdings, LLC (“LSAIH”) and subsequent distribution of all of the equity interests of LSAIH to the sellers and (ii) LSP’s acquisition of the remaining equity interests in ACE Aggregates, LLC, in which LSP previously owned a minority interest. LSP financials reflect the results of operations of Lone Star Concrete, LLC and Lone Star Precast, LLC, entities in which LSP owns a minority interest but that divested of substantially all of their assets CONFIDENTIAL during the six months ended June 30, 2024. 43
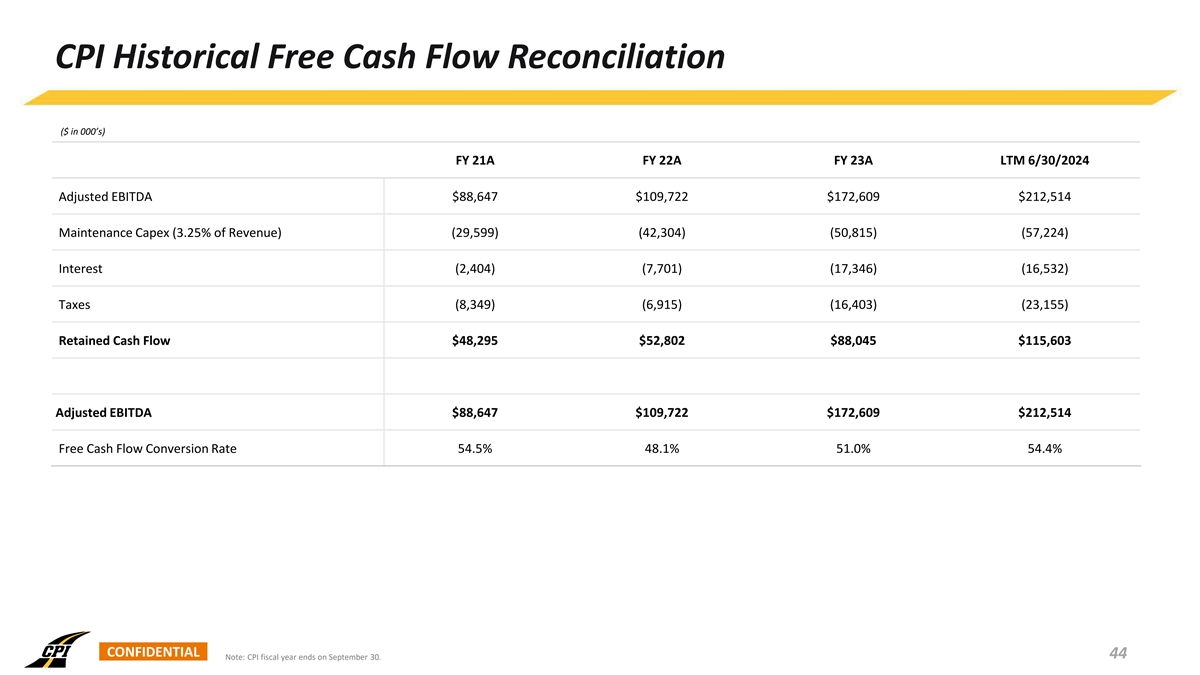
CPI Historical Free Cash Flow Reconciliation ($ in 000’s) FY 21A FY 22A FY 23A LTM 6/30/2024 Adjusted EBITDA $88,647 $109,722 $172,609 $212,514 Maintenance Capex (3.25% of Revenue) (29,599) (42,304) (50,815) (57,224) (2,404) (7,701) (17,346) (16,532) Interest Taxes (8,349) (6,915) (16,403) (23,155) Retained Cash Flow $48,295 $52,802 $88,045 $115,603 Adjusted EBITDA $88,647 $109,722 $172,609 $212,514 54.5% 48.1% 51.0% 54.4% Free Cash Flow Conversion Rate CONFIDENTIAL 44 Note: CPI fiscal year ends on September 30.
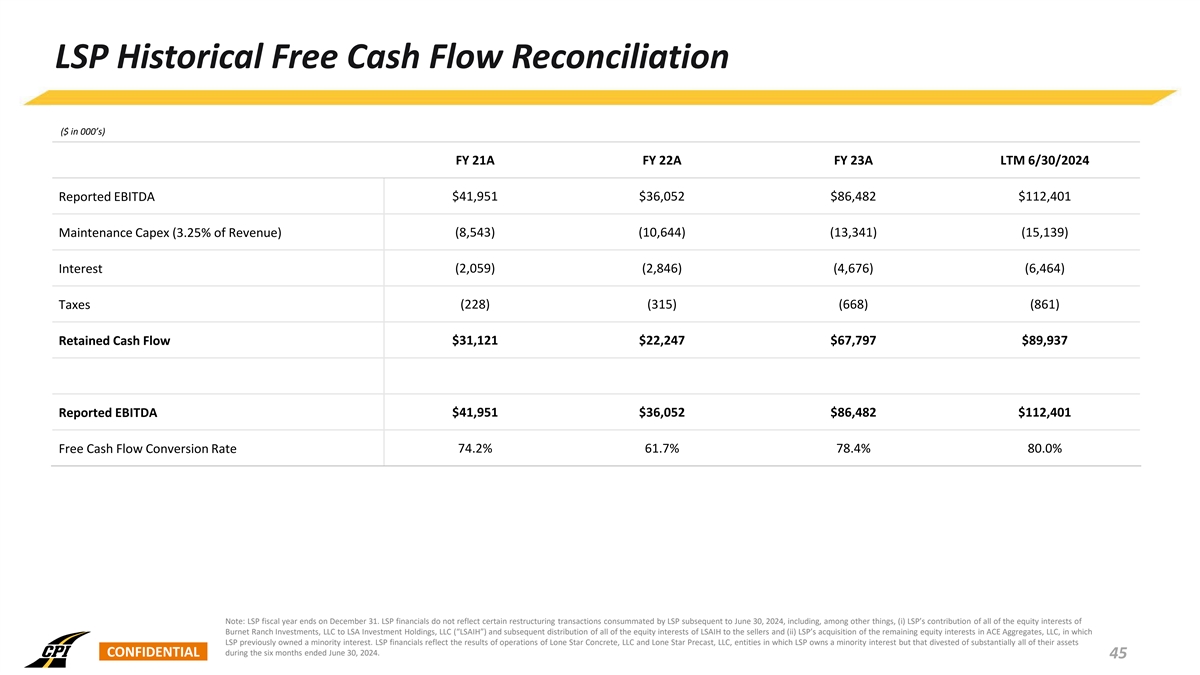
LSP Historical Free Cash Flow Reconciliation ($ in 000’s) FY 21A FY 22A FY 23A LTM 6/30/2024 Reported EBITDA $41,951 $36,052 $86,482 $112,401 (8,543) (10,644) (13,341) (15,139) Maintenance Capex (3.25% of Revenue) (2,059) (2,846) (4,676) (6,464) Interest Taxes (228) (315) (668) (861) Retained Cash Flow $31,121 $22,247 $67,797 $89,937 $41,951 $36,052 $86,482 $112,401 Reported EBITDA 74.2% 61.7% 78.4% 80.0% Free Cash Flow Conversion Rate Note: LSP fiscal year ends on December 31. LSP financials do not reflect certain restructuring transactions consummated by LSP subsequent to June 30, 2024, including, among other things, (i) LSP’s contribution of all of the equity interests of Burnet Ranch Investments, LLC to LSA Investment Holdings, LLC (“LSAIH”) and subsequent distribution of all of the equity interests of LSAIH to the sellers and (ii) LSP’s acquisition of the remaining equity interests in ACE Aggregates, LLC, in which LSP previously owned a minority interest. LSP financials reflect the results of operations of Lone Star Concrete, LLC and Lone Star Precast, LLC, entities in which LSP owns a minority interest but that divested of substantially all of their assets CONFIDENTIAL during the six months ended June 30, 2024. 45
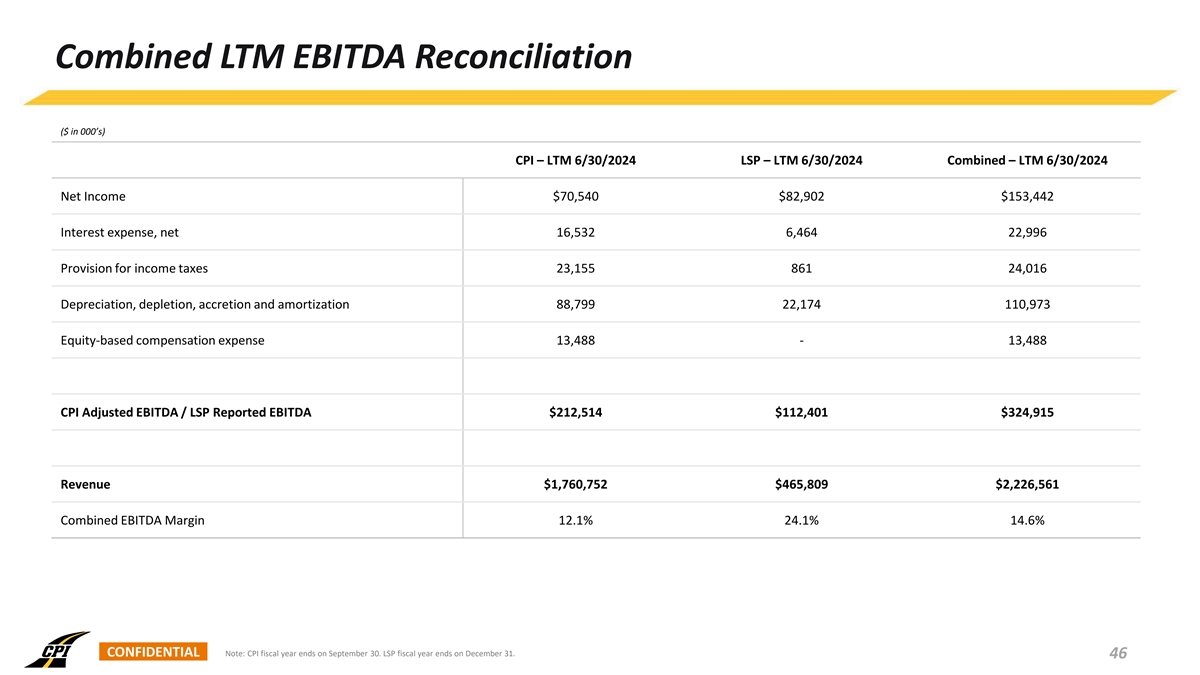
Combined LTM EBITDA Reconciliation ($ in 000’s) CPI – LTM 6/30/2024 LSP – LTM 6/30/2024 Combined – LTM 6/30/2024 Net Income $70,540 $82,902 $153,442 Interest expense, net 16,532 6,464 22,996 Provision for income taxes 23,155 861 24,016 Depreciation, depletion, accretion and amortization 88,799 22,174 110,973 Equity-based compensation expense 13,488 - 13,488 CPI Adjusted EBITDA / LSP Reported EBITDA $212,514 $112,401 $324,915 Revenue $1,760,752 $465,809 $2,226,561 Combined EBITDA Margin 12.1% 24.1% 14.6% CONFIDENTIAL Note: CPI fiscal year ends on September 30. LSP fiscal year ends on December 31. 46
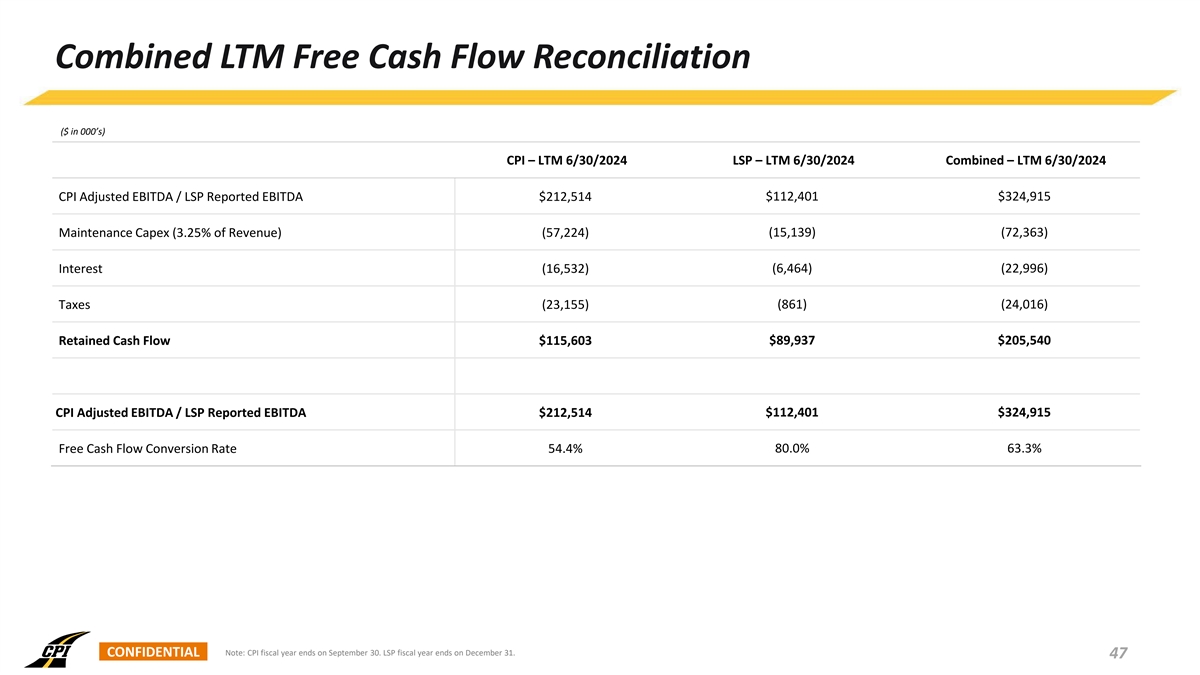
Combined LTM Free Cash Flow Reconciliation ($ in 000’s) CPI – LTM 6/30/2024 LSP – LTM 6/30/2024 Combined – LTM 6/30/2024 CPI Adjusted EBITDA / LSP Reported EBITDA $212,514 $112,401 $324,915 (15,139) (72,363) Maintenance Capex (3.25% of Revenue) (57,224) (16,532) (6,464) (22,996) Interest Taxes (23,155) (861) (24,016) Retained Cash Flow $115,603 $89,937 $205,540 $112,401 $324,915 CPI Adjusted EBITDA / LSP Reported EBITDA $212,514 54.4% 80.0% 63.3% Free Cash Flow Conversion Rate CONFIDENTIAL Note: CPI fiscal year ends on September 30. LSP fiscal year ends on December 31. 47
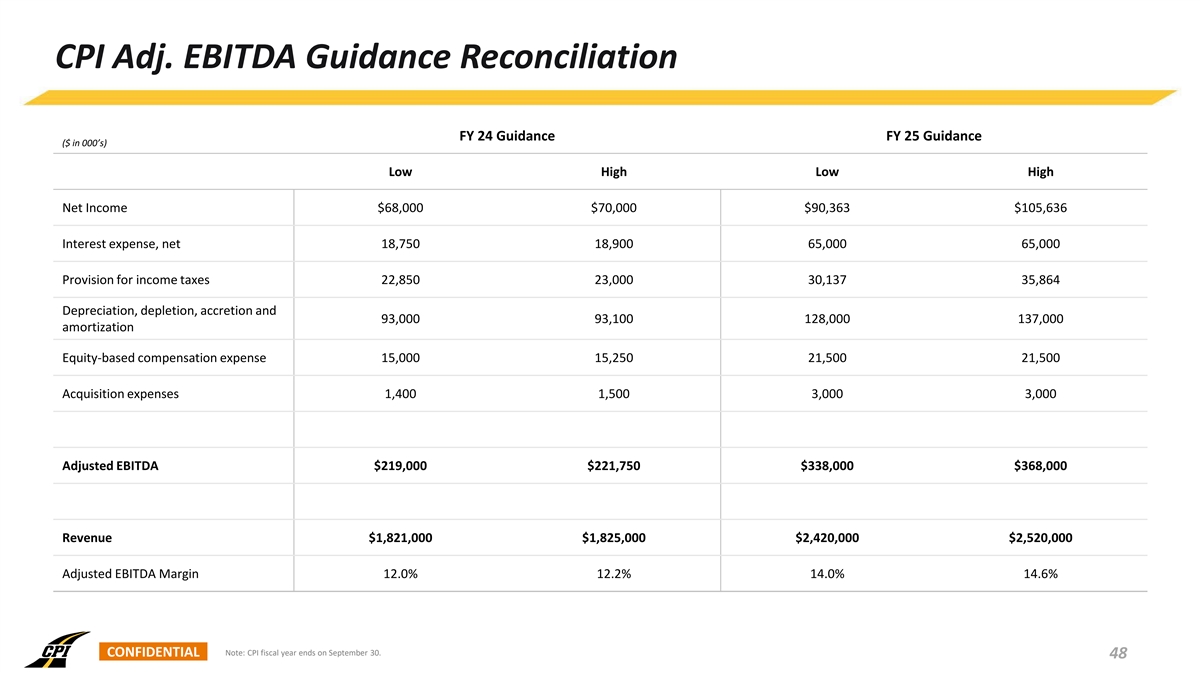
CPI Adj. EBITDA Guidance Reconciliation FY 24 Guidance FY 25 Guidance ($ in 000’s) Low High Low High Net Income $68,000 $70,000 $90,363 $105,636 Interest expense, net 18,750 18,900 65,000 65,000 Provision for income taxes 22,850 23,000 30,137 35,864 Depreciation, depletion, accretion and 93,000 93,100 128,000 137,000 amortization Equity-based compensation expense 15,000 15,250 21,500 21,500 Acquisition expenses 1,400 1,500 3,000 3,000 Adjusted EBITDA $219,000 $221,750 $338,000 $368,000 Revenue $1,821,000 $1,825,000 $2,420,000 $2,520,000 Adjusted EBITDA Margin 12.0% 12.2% 14.0% 14.6% CONFIDENTIAL Note: CPI fiscal year ends on September 30. 48
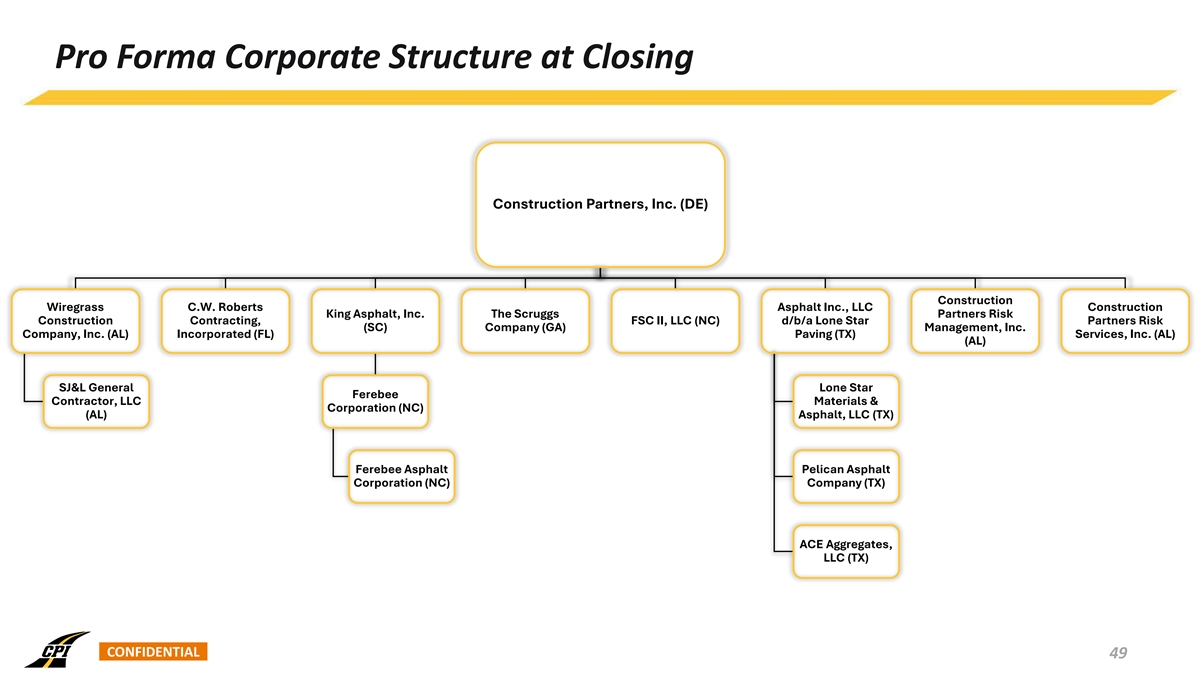
Pro Forma Corporate Structure at Closing Construction Partners, Inc. (DE) Construction Wiregrass C.W. Roberts Asphalt Inc., LLC Construction King Asphalt, Inc. The Scruggs Partners Risk Construction Contracting, FSC II, LLC (NC) d/b/a Lone Star Partners Risk (SC) Company (GA) Management, Inc. Company, Inc. (AL) Incorporated (FL) Paving (TX) Services, Inc. (AL) (AL) SJ&L General Lone Star Ferebee Contractor, LLC Materials & Corporation (NC) (AL) Asphalt, LLC (TX) Ferebee Asphalt Pelican Asphalt Corporation (NC) Company (TX) ACE Aggregates, LLC (TX) CONFIDENTIAL 49